The OpenTelemetry Collector, when configured with a Prometheus receiver, provides an integration with kube-state-metrics to scrape Prometheus metrics. The Collector uses the Prometheus Receiver to fetch metrics from the configured path. From there, the metrics are processed and exported to Cloud Observability.
To quickly ingest Kubernetes metrics into Cloud Observability using the OpenTelemetry Operator for Kubernetes, see instructions in the Kubernetes Quick Start.
To complete the integration, you will:
- Configure kube-state-metrics to use the Prometheus exporter.
- Configure the Collector to use the kube-state-metrics endpoint as a scrape target for the Prometheus receiver.
- Enable the integration by adding it to a pipeline.
Prerequisites
You’ve configured the Collector to export metric data to Cloud Observability.
Configure kube-state-metrics reporting
You may need to expose kube-state-metrics Prometheus metrics. How you do that depends on your deployment model and whether or not the default parameters are appropriate in your case. In kube-state-metrics, Prometheus metrics are on port 8080 by default.
For more details about using kube-state-metrics with the Prometheus exporter, see the official kube-state-metrics documentation.
Configure the Collector receiver
In the Collector configuration file, configure the Prometheus receiver to use the kube-state-metrics Prometheus endpoint as a scrape target.
1
2
3
4
5
6
7
receivers:
  prometheus:
  config:
    scrape_configs:
      - job_name: 'otel-ksm'
        static_configs:
          - targets: ['ksm.kube-system.svc.cluster.local']
The OpenTelemetry repo’s README provides additional details about Prometheus receiver configuration.
More details about the Prometheus scrape configuration can be found here.
Enable the Collector receiver
Once the kube-state-metrics receiver is configured, enable it by adding it to one or more pipelines as described in the Collector configuration documentation.
Validate metrics are reporting to Cloud Observability
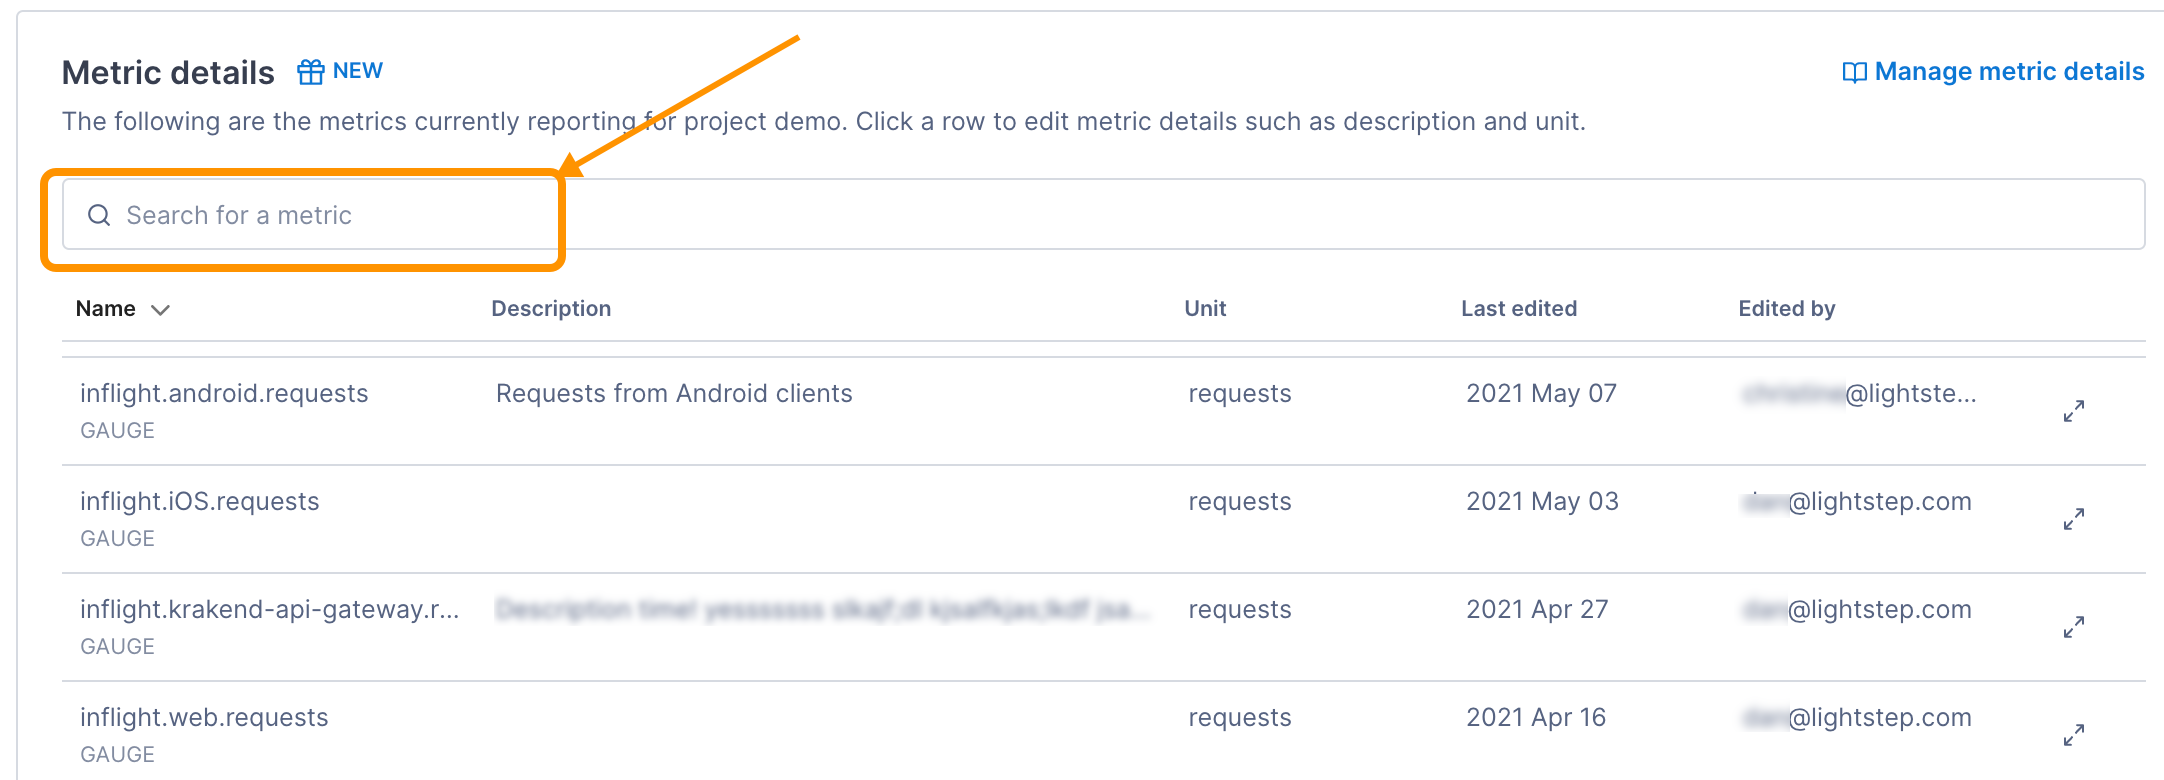
You can validate that metrics are reporting to Cloud Observability on the Metrics details page in Settings.
-
In Cloud Observability, click Settings > Metric details.
-
Search for kube-state-metrics metric names.

-
If needed, click on the metric to edit the description and how the units are displayed in Cloud Observability.
Create a dashboard for the metrics
Use the Cloud Observability Terraform Provider to create a dashboard for the metrics.
Additional resources
Learn more about how to Ingest Prometheus metrics using an OpenTelemetry Collector on Kubernetes.
There is a pre-made Cloud Observability dashboard to help you quickly visualize kube-state-metrics monitoring.
See also
Updated Dec 1, 2022
