The OpenTelemetry Collector provides an integration with the Collector’s host to ingest health metrics. When configured to use the Host metrics integration, the Collector can fetch the following metrics from the configured path in the Host metrics receiver:
| Metric type | Metrics collected/emitted |
|---|---|
| CPU | CPU metrics |
| Disk | Disk metrics |
| File system | File system metrics |
| Load | Load metrics |
| Memory | Memory metrics |
| Network | Network metrics |
| Paging (swap) | Paging metrics |
| Process | Process metrics |
| Processes | Processes metrics |
From there the metrics are processed and exported to Cloud Observability.
To complete the integration, you will:
- Configure the Host metrics receiver for the Collector
- Enable the integration by adding it to a pipeline
Prerequisites
- You’ve installed the Collector onto the host machine
- You’ve configured the Collector to export metric data to Cloud Observability.
Configure the Collector receiver
In the Collector configuration file, add Host metrics as a receiver and set the scrapers you wish to collect metrics for. You can add one, all, or a combination of the following:
cpudiskfilesystemloadmemorynetworkpagingprocessprocesses
This example is scraping for both CPU and disk metrics:
1
2
3
4
5
receivers:
  hostmetrics:
    scrapers:
      cpu:
      disk:
The OpenTelemetry repo readme provides additional details about Host metrics configuration.
Enable the Collector receiver
Once the Host metrics receiver is configured, enable it by adding it to one or more pipelines as described in the Collector configuration documentation.
Validate metrics are reporting to Cloud Observability
You can validate that metrics are reporting to Cloud Observability on the Metrics details page in Settings.
-
In Cloud Observability, click Settings > Metric details.
-
Search for Linux Host metrics metric names.

See the table at the top of this page for links to the complete list of emitted metrics.
-
If needed, click on the metric to edit the description and how the units are displayed in Cloud Observability.
Create a dashboard for the metrics
Use the Cloud Observability Terraform Provider to create a dashboard for the metrics. 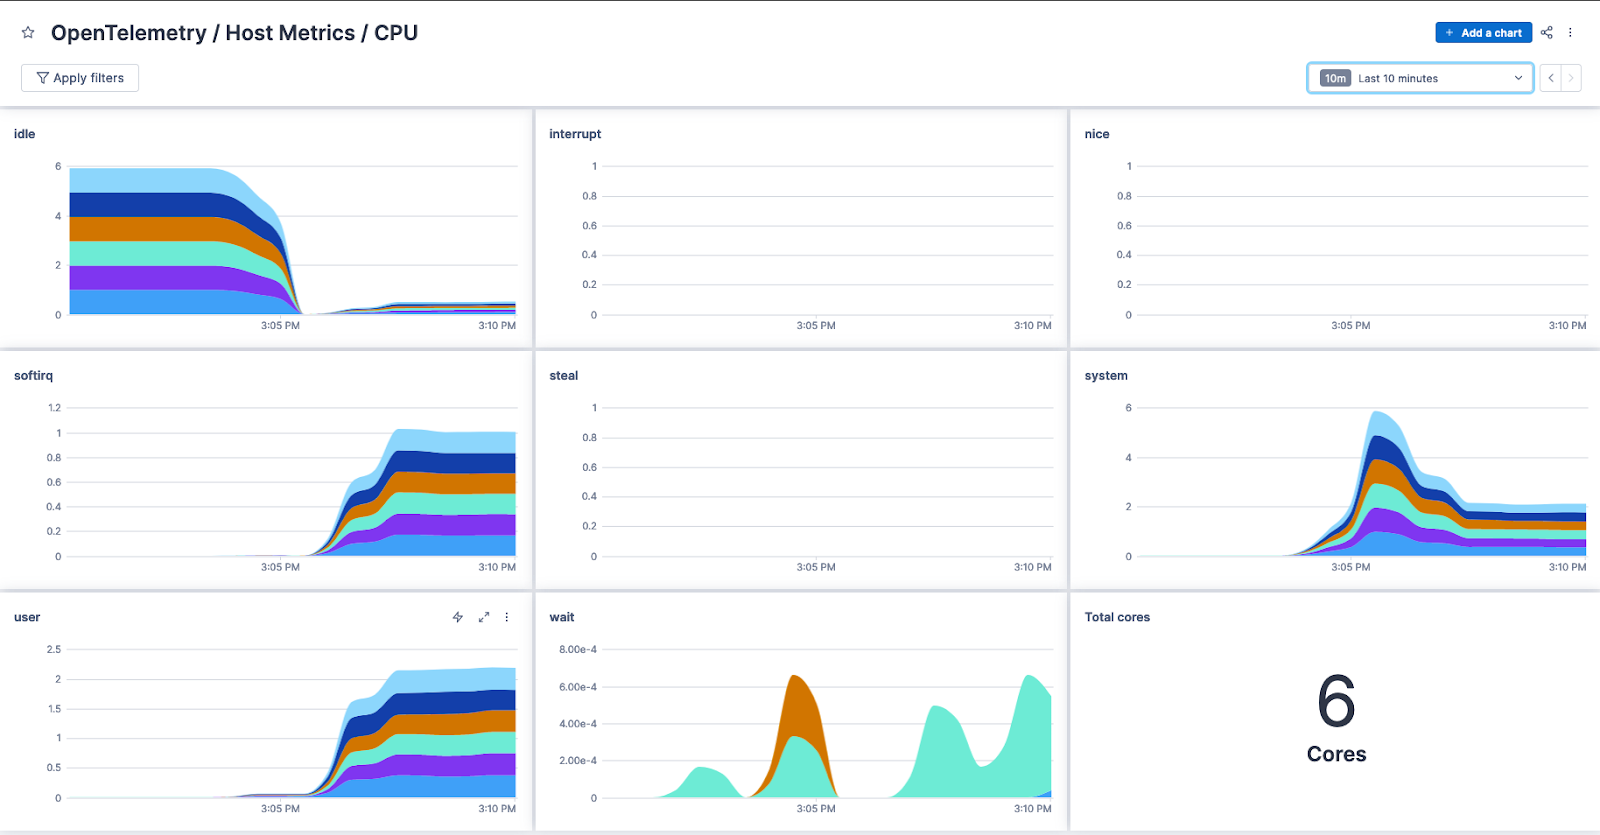
Additional resources
For a more complete example that’s ready to run, see the Host metrics integration in Cloud Observability OpenTelemetry Examples.
See also
Updated Dec 1, 2022