The OpenTelemetry Collector, when configured with a Prometheus receiver, provides an integration with Micrometer to scrape Prometheus metrics. The Collector uses the Prometheus Receiver to fetch metrics from the configured path in the JDK’s HTTPServer class. From there, the metrics are processed and exported to Cloud Observability.
To complete the integration, you will:
- Configure Micrometer to use the Prometheus exporter.
- Configure the Collector to use the Micrometer endpoint as a scrape target for the Prometheus receiver.
- Enable the integration by adding it to a pipeline.
Prerequisites
You’ve configured the Collector to export metric data to Cloud Observability.
Configure Micrometer reporting
You need to configure your Spring Boot application to use the Prometheus exporter. Then you need to define the Prometheus endpoint in the JDK’s HTTPServer class.
-
Using Gradle or Maven, add Prometheus support to your Spring Boot application.
Start tabs
Gradle
1
2
 implementation
 'io.micrometer:micrometer-registry-prometheus:latest.release'
Maven
1
2
3
4
5
 <dependency>
   <groupId>io.micrometer</groupId>
   <artifactId>micrometer-registry-prometheus</artifactId>
   <version>${micrometer.version}</version>
 </dependency>
End code tabs
-
Configure the Spring Boot
Actuatorto expose the Prometheus endpoints.
In theapplication.propertiessection, add the following:1 2 3 4
management.endpoints.web.exposure.include=* management.endpoints.web.exposure.include=prometheus,health,info,metric management.health.probes.enabled=true management.endpoint.health.show-details=always
-
In the JDK’s
com.sun.net.httpserver.HTTPServerclass, expose the scrape endpoint.
1
2
3
4
5
6
7
8
9
10
11
12
13
14
15
16
17
18
19
20
21
22
23
24
25
26
27
28
29
public static PrometheusMeterRegistry prometheus() {
  PrometheusMeterRegistry prometheusRegistry = new PrometheusMeterRegistry(new PrometheusConfig() {

    @Override
    public Duration step() {
      return Duration.ofSeconds(10);
    }

    @Override
    @Nullable
    public String get(String k) {
      return null;
    }
  });
  try {
    HttpServer server = HttpServer.create(new InetSocketAddress(8080), 0);
    server.createContext("/prometheus", httpExchange -> {
      String response = prometheusRegistry.scrape();
      httpExchange.sendResponseHeaders(200, response.length());
      OutputStream os = httpExchange.getResponseBody();
      os.write(response.getBytes());
      os.close();
    });
    new Thread(server::start).run();
  } catch (IOException e) {
      throw new RuntimeException(e);
    }
  return prometheusRegistry;
}
For more details about using Micrometer with the Prometheus exporter, see the official Micrometer documentation.
Configure the Collector receiver
In the Collector configuration file, configure the Prometheus receiver to use the Micrometer Prometheus endpoint as a scrape target.
1
2
3
4
5
6
7
8
9
10
11
12
13
receivers:
  prometheus:
      config:
        scrape_configs:
          - job_name: 'micrometer'
            scrape_inteval: 10s
            scrape_timeout: 20s
            metrics_path: '/actuator/prometheus'
            scheme: 'http'
            tls_config:
              Insecure_skip_verify: true
            static_configs:
              - targets: ['localhost:8080']
The OpenTelemetry repo’s README provides additional details about Prometheus receiver configuration.
More details about the Prometheus scrape configuration can be found here.
Enable the Collector receiver
Once the Micrometer receiver is configured, enable it by adding it to one or more pipelines as described in the Collector configuration documentation.
Validate metrics are reporting to Cloud Observability
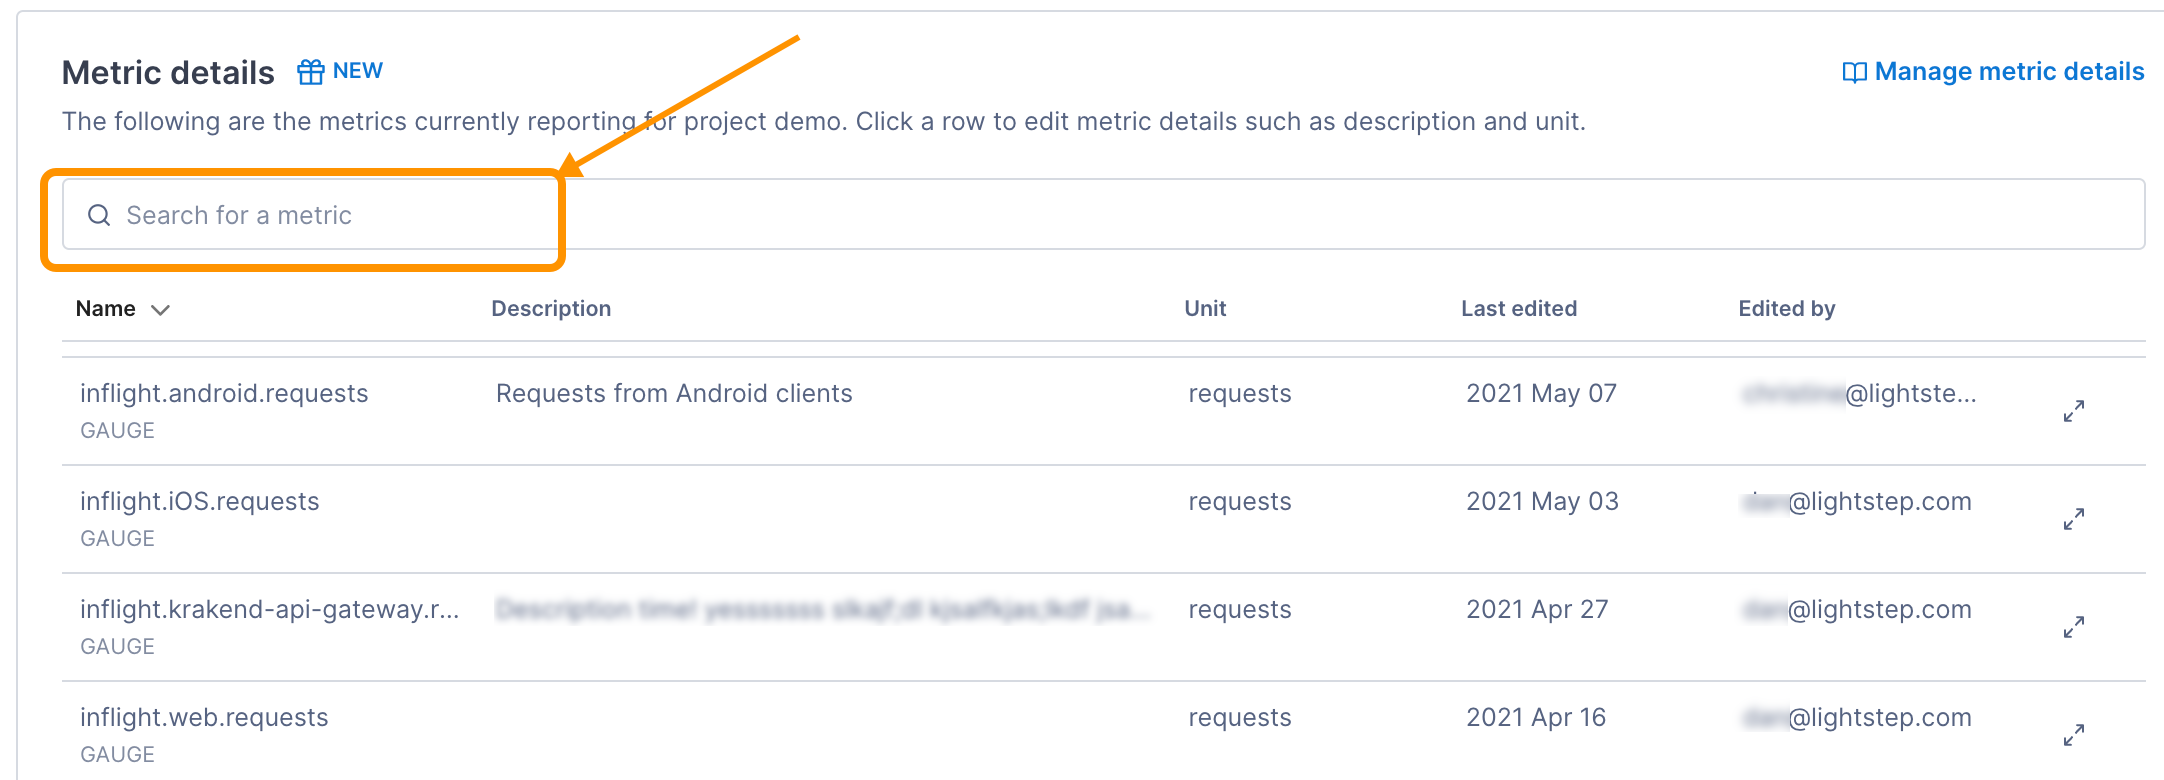
You can validate that metrics are reporting to Cloud Observability on the Metrics details page in Settings.
-
In Cloud Observability, click Settings > Metric details.
-
Search for Micrometer metric names.

-
If needed, click on the metric to edit the description and how the units are displayed in Cloud Observability.
Create a dashboard for the metrics
Use the Cloud Observability Terraform Provider to create a dashboard for the metrics.
Additional resources
For a more complete example that’s ready to run, see the Micrometer integration in Cloud Observability OpenTelemetry Examples.
See also
Updated Dec 1, 2022
