The OpenTelemetry Collector provides an integration with MongoDB to ingest metrics. The Collector fetches metrics from the configured path in the MongoDB receiver. From there the metrics are processed and exported to Cloud Observability.
To complete the integration, you will:
- Configure MongoDB to report metrics to the Collector
- Configure the MongoDB receiver for the Collector
- Enable the integration by adding it to a pipeline
Prerequisites
- MongoDB v5.0 or later Community Edition
- You’ve configured the Collector to export metric data to Cloud Observability.
Configure MongoDB reporting
MongoDB receiver fetches stats from a MongoDB instance using the golang mongo driver. Stats are collected using MongoDB’s dbStats and serverStatus commands.
The details of your configuration will vary with the infrastructure that you run.
1
go get go.mongodb.org/mongo-driver/mongo
Example
1
2
3
4
5
6
7
8
9
10
11
import (
    ...
    "go.mongodb.org/mongo-driver/mongo"
    "go.mongodb.org/mongo-driver/mongo/options"
    "go.mongodb.org/mongo-driver/mongo/readpref"
    ...
)

ctx, cancel := context.WithTimeout(context.Background(), 10*time.Second)
defer cancel()
client, err := mongo.Connect(ctx, options.Client().ApplyURI("mongodb://localhost:27017"))
For more details about configuring Mongodb, see the Mongodb documentation, and more generally, the Mongodb tutorial.
Configure the Collector receiver
In the Collector configuration file, add MongoDB as a receiver and set the following:
hosts(default: [localhost:27017]): list ofhost:portor unix domain socket endpoints.- For standalone MongoDB deployments, this is the hostname and port of the MongoDB instance.
- For replica sets, specify the hostnames and ports of the MongoDB instances that are in the replica set configuration. If the
replica_setfield is specified, nodes will be autodiscovered. - For a sharded MongoDB deployment, please specify a list of the
mongoshosts.
username(if authentication is required): the user name.password(if authentication is required): Password for MongoDB.collection_interval: (default = 1m): This receiver collects metrics on an interval. This value must be a string readable by Golang’s time.ParseDuration. Valid time units arens,us(orµs),ms,s,m,h.replica_set: If the deployment of MongoDB is a replica set then this allows users to specify the replica set name, which allows for autodiscovery of other nodes in the replica set.timeout: (default is1m) The timeout of running commands against mongo.tls:insecure(default is false): whether to enable client transport security for the exporter’s gRPC connection.insecure_skip_verify(default is false): whether to skip verifying the certificate or not.
1
2
3
4
5
6
7
8
9
10
11
12
receivers:
  mongodb:
    hosts:
      - endpoint: localhost:27017
    # Required.
    username: otel
    # Required.
    password: $MONGODB_PASSWORD
    collection_interval: 60s
    tls:
      insecure: true
      insecure_skip_verify: true
The OpenTelemetry repo’s readme provides additional details about MongoDB configuration.
Enable the Collector receiver
Once the MongoDB receiver is configured, enable it by adding it to one or more pipelines as described in the Collector configuration documentation.
Validate metrics are reporting to Cloud Observability
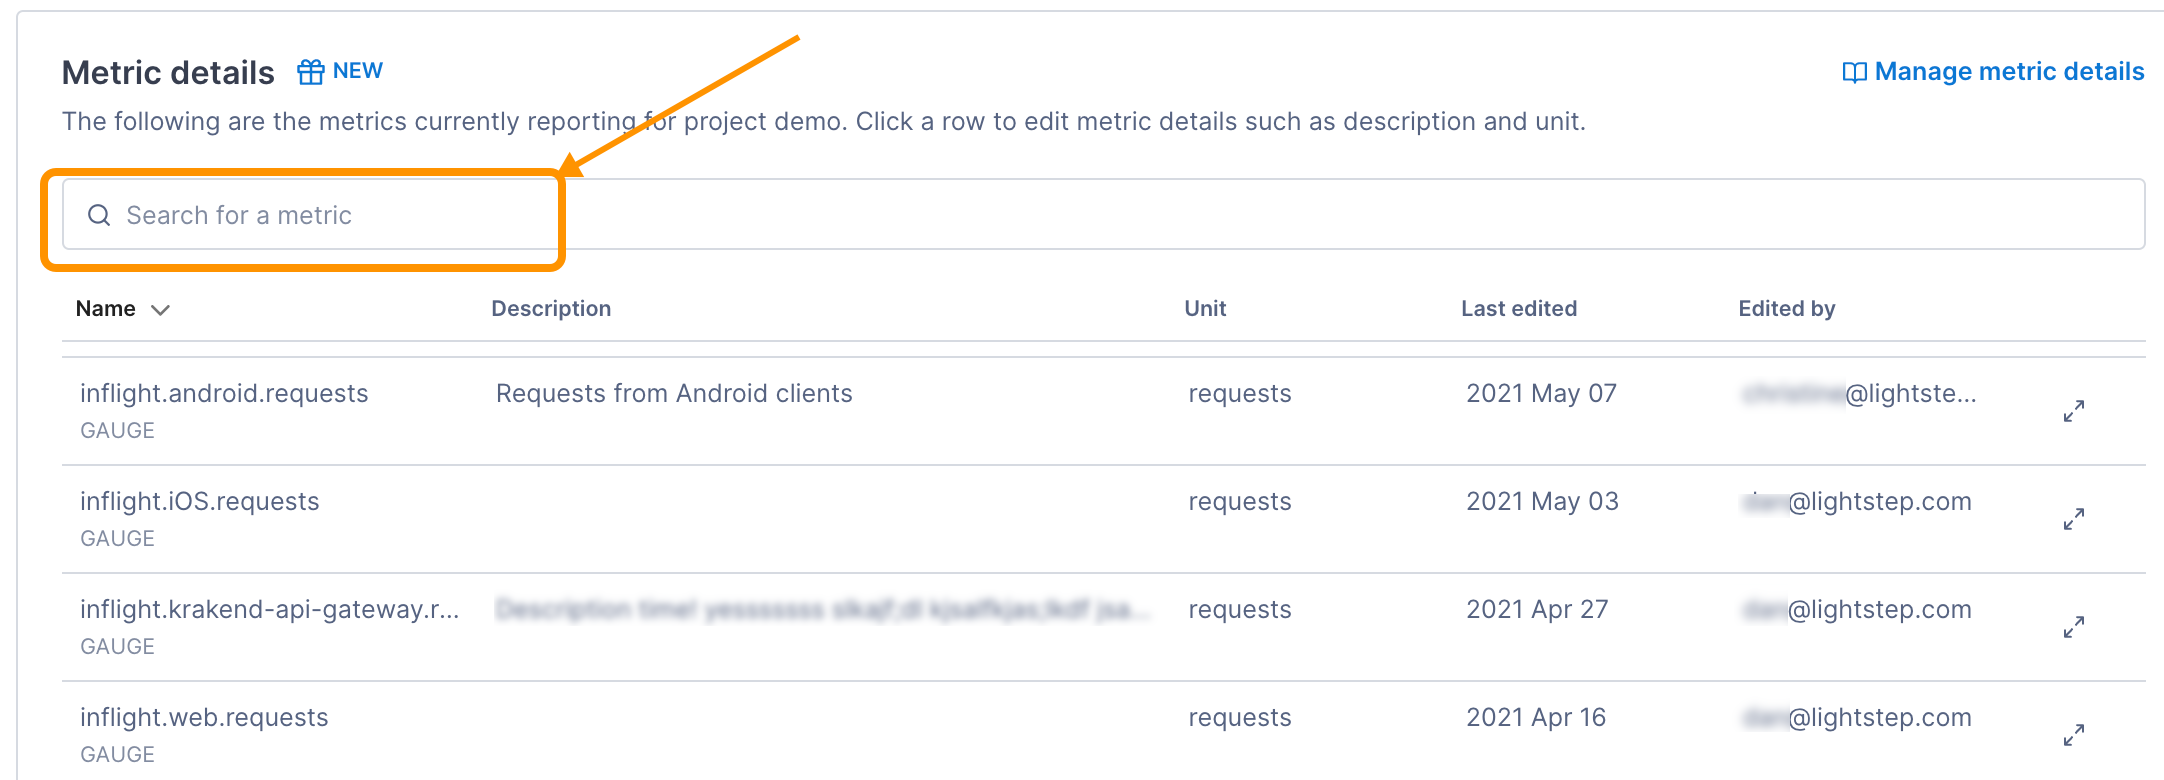
You can validate that metrics are reporting to Cloud Observability on the Metrics details page in Settings.
-
In Cloud Observability, click Settings > Metric details.
-
Search for MongoDB metric names.

See the receiver’s metadata file for a complete list of emitted metrics.
-
If needed, click on the metric to edit the description and how the units are displayed in Cloud Observability.
Create a dashboard for the metrics
You can create a pre-built dashboard for this integration from the Dashboard list view. Or use the Cloud Observability Terraform Provider to create a dashboard.
Additional resources
For a more complete example that’s ready to run, see the MongoDB integration in Cloud Observability OpenTelemetry Examples.
See also
Updated Dec 1, 2022
