The OpenTelemetry Collector provides integration with Java/JMX through a receiver in the contrib repo located at OpenTelemetry Collector Contrib, which launches and manages the OpenTelemetry JMX Metric Gatherer as a subprocess. When configured to use the JMX receiver, the Collector fetches metrics from a target MBean server using built-in profiles, such as JVM, Kafka Consumer, Kafka Producer or Cassandra. From there the metrics are processed and exported to Cloud Observability.
To complete the integration, you will:
- Configure JMX to report metrics to the OpenTelemetry Collector
- Configure the JMX receiver for the Collector
- Enable the integration by adding it to a pipeline
Prerequisites
You’ve configured the Collector to export metric data to Cloud Observability.
Configure JMX reporting
Configure a JMX remote connection for the Collector receiver to connect to the executing Java Virtual Machine.
This example shows JMX configured without authentication:
1
2
3
4
5
java -Dcom.sun.management.jmxremote \
     -Dcom.sun.management.jmxremote.port=$PORT_NUMBER \
     -Dcom.sun.management.jmxremote.authenticate=false \
     -Dcom.sun.management.jmxremote.ssl=false \
     -cp MyApp.jar com.mycompany.App
For more details regarding configuring the JMX remote connection, see the official JMX documentation.
Configure the Collector receiver
In the Collector configuration file, add JMX as a receiver and set the following:
jar_path: The path to the OpenTelemetry JMX metrics jar file.endpoint: The endpoint of the host:port for the running application.target_system: The metrics to collect. Values can be combined. Some of the supported values are:jvm: Java Virtual Machine metrics. Recommended for all scenarios.kafka: General Kafka metrics, including broker metrics.kafka-producer: Kafka producer metrics.kafka-consumer: Kafka consumer metrics.activemq: ActiveMQ metrics.cassandra: Cassandra metrics.
1
2
3
4
5
6
7
8
9
receivers:
  jmx:
    # Default is /opt/opentelemetry-java-contrib-jmx-metrics.jar
    jar_path: /opt/opentelemetry-jmx-metrics.jar

    endpoint: localhost:$PORT_NUMBER # Required.
    target_system: jvm # Required.
    username: $USERNAME # Optional.
    password: $PASSWORD # Optional.
This example shows multiple target systems:
1
2
3
4
5
receivers:
  jmx:
    jar_path: /opt/opentelemetry-jmx-metrics.jar
    endpoint: 'localhost:1234'
    target_system: jvm,kafka
Target systems documentation and their reported metrics can be found in the JMX Metrics Gatherer.
The OpenTelemetry repo’s readme provides additional details about JMX configuration.
Enable the Collector receiver
Once the JMX receiver is configured, enable it by adding it to one or more pipelines as described in the Collector configuration documentation.
Validate metrics are reporting to Cloud Observability
You can validate that metrics are reporting to Cloud Observability on the Metrics details page in Settings.
-
In Cloud Observability, click Settings > Metric details.
-
Search for JMX metric names.

-
If needed, click on the metric to edit the description and how the units are displayed in Cloud Observability.
View metrics in Cloud Observability
Once you have Cloud Observability ingesting the JMX metrics, you can use the Cloud Observability Terraform Provider to create a dashboard for the metrics. 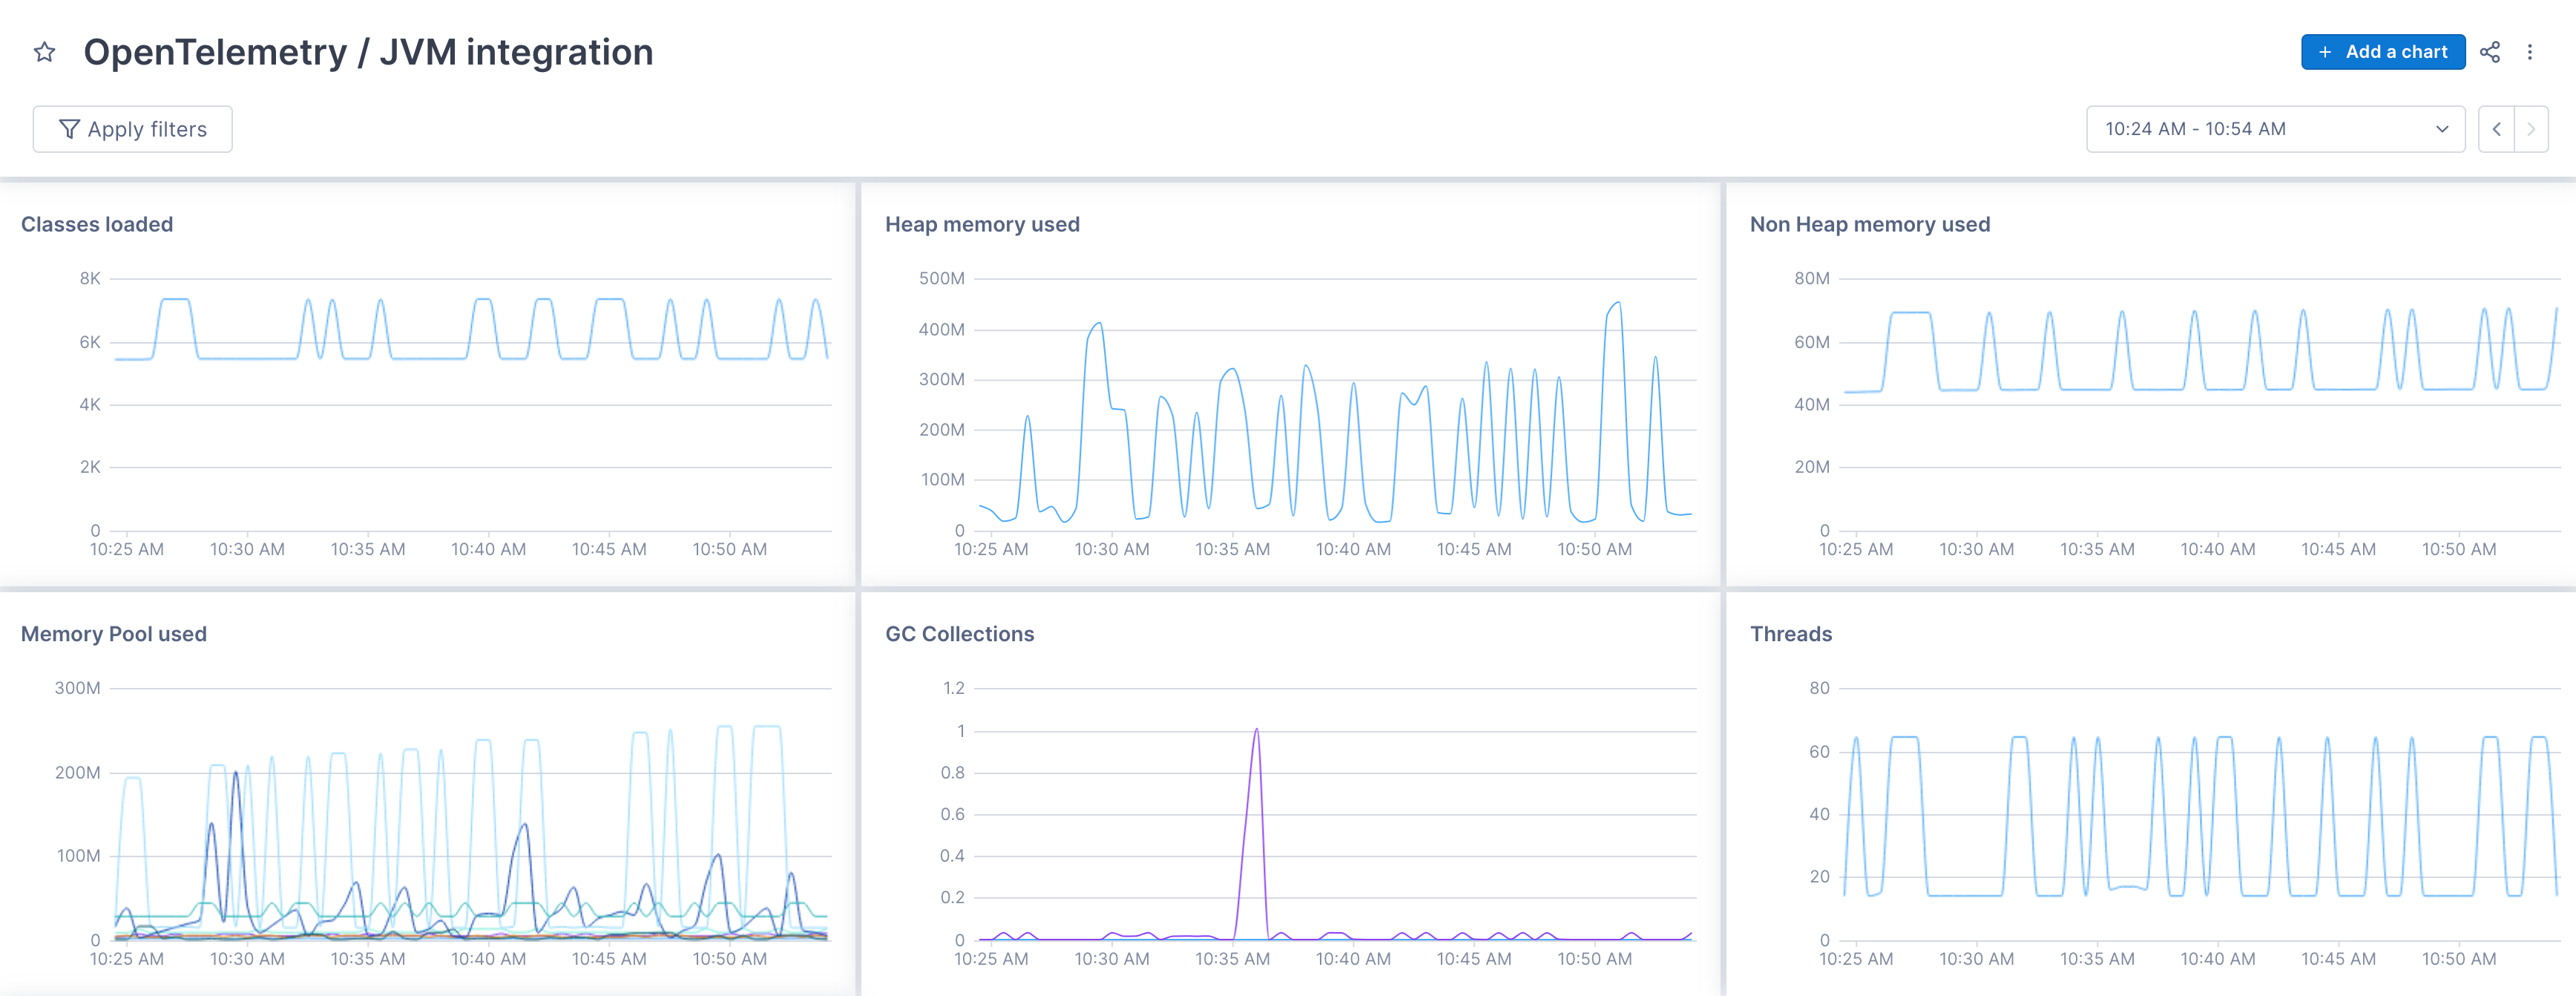
See also
Updated Dec 1, 2022