The OpenTelemetry Collector provides integration with Kafka through a receiver in the contrib repo located at OpenTelemetry Collector Contrib. For more complete metrics coverage, we recommend that you also use the the JMX receiver to collect additional JMX metrics from Kafka that focus on brokers and producers. From there the metrics are processed and exported to Cloud Observability.
To complete the integration, you will:
- Configure Kafka to report metrics to the OpenTelemetry Collector
- Configure the Kafka receiver for the Collector
- Enable the integration by adding it to a pipeline
Prerequisites
You’ve configured the Collector to export metric data to Cloud Observability.
Configure Kafka JMX reporting
Configure a JMX remote connection to collect the main Kafka broker and producer metrics.
This example shows JMX with no authentication:
1
JMX_PORT=9999 ./bin/kafka-server-start.sh
For more details regarding configuring the JMX remote connection for Kafka, see the official Kafka documentation.
Configure the Collector receiver
In the Collector configuration file, add JMX and Kafka as a receiver and set the following:
- Add
jmxas a receiver and set the following:jar_path: The path to the OpenTelemetry JMX metrics jar file.endpoint: The endpoint of the host:port for the running application.target_system: The metrics to collect. Values can be combined. Valid values are:kafka: General Kafka metrics, including broker metrics.kafka-producer: Kafka producer metrics.kafka-consumer: Kafka consumer metrics.jvm: Java Virtual Machine metrics. Recommended for all scenarios.
1
2
3
4
5
receivers:
  jmx:
    jar_path: /opt/opentelemetry-jmx-metrics.jar
    endpoint: localhost:9999
    target_system: kafka,jvm
See additional configuration options for the JMX receiver here.
- Add
kafkametricsas a receiver and set the following:protocol_version: The Kafka protocol versionscrapers: Any combination ofconsumers,topicsandbrokers.brokers(optional): The list of brokers to read from. Default islocalhost:9092
This segment of a collector configuration shows a minimal example for the Kafka receiver:
1
2
3
4
5
6
7
8
receivers:
  kafkametrics:
    protocol_version: 2.0.0 # Required.
    scrapers: # Required.
      - consumers
      - topics
      - brokers
    brokers: localhost:9092 # Optional.
The OpenTelemetry repo’s readme provides additional details about Kafka integration.
Enable the Collector receiver
Once the JMX and Kafka receivers are configured, enable them by adding them to one or more pipelines as described in the Collector configuration documentation.
Validate metrics are reporting to Cloud Observability
You can validate that metrics are reporting to Cloud Observability on the Metrics details page in Settings.
-
In Cloud Observability, click Settings > Metric details.
-
Search for Kafka metric names.

-
If needed, click on the metric to edit the description and how the units are displayed in Cloud Observability.
View metrics in Cloud Observability
Once you have Cloud Observability ingesting the Kafka and JMX metrics, you can use the Cloud Observability Terraform Provider to create a dashboard for the metrics. 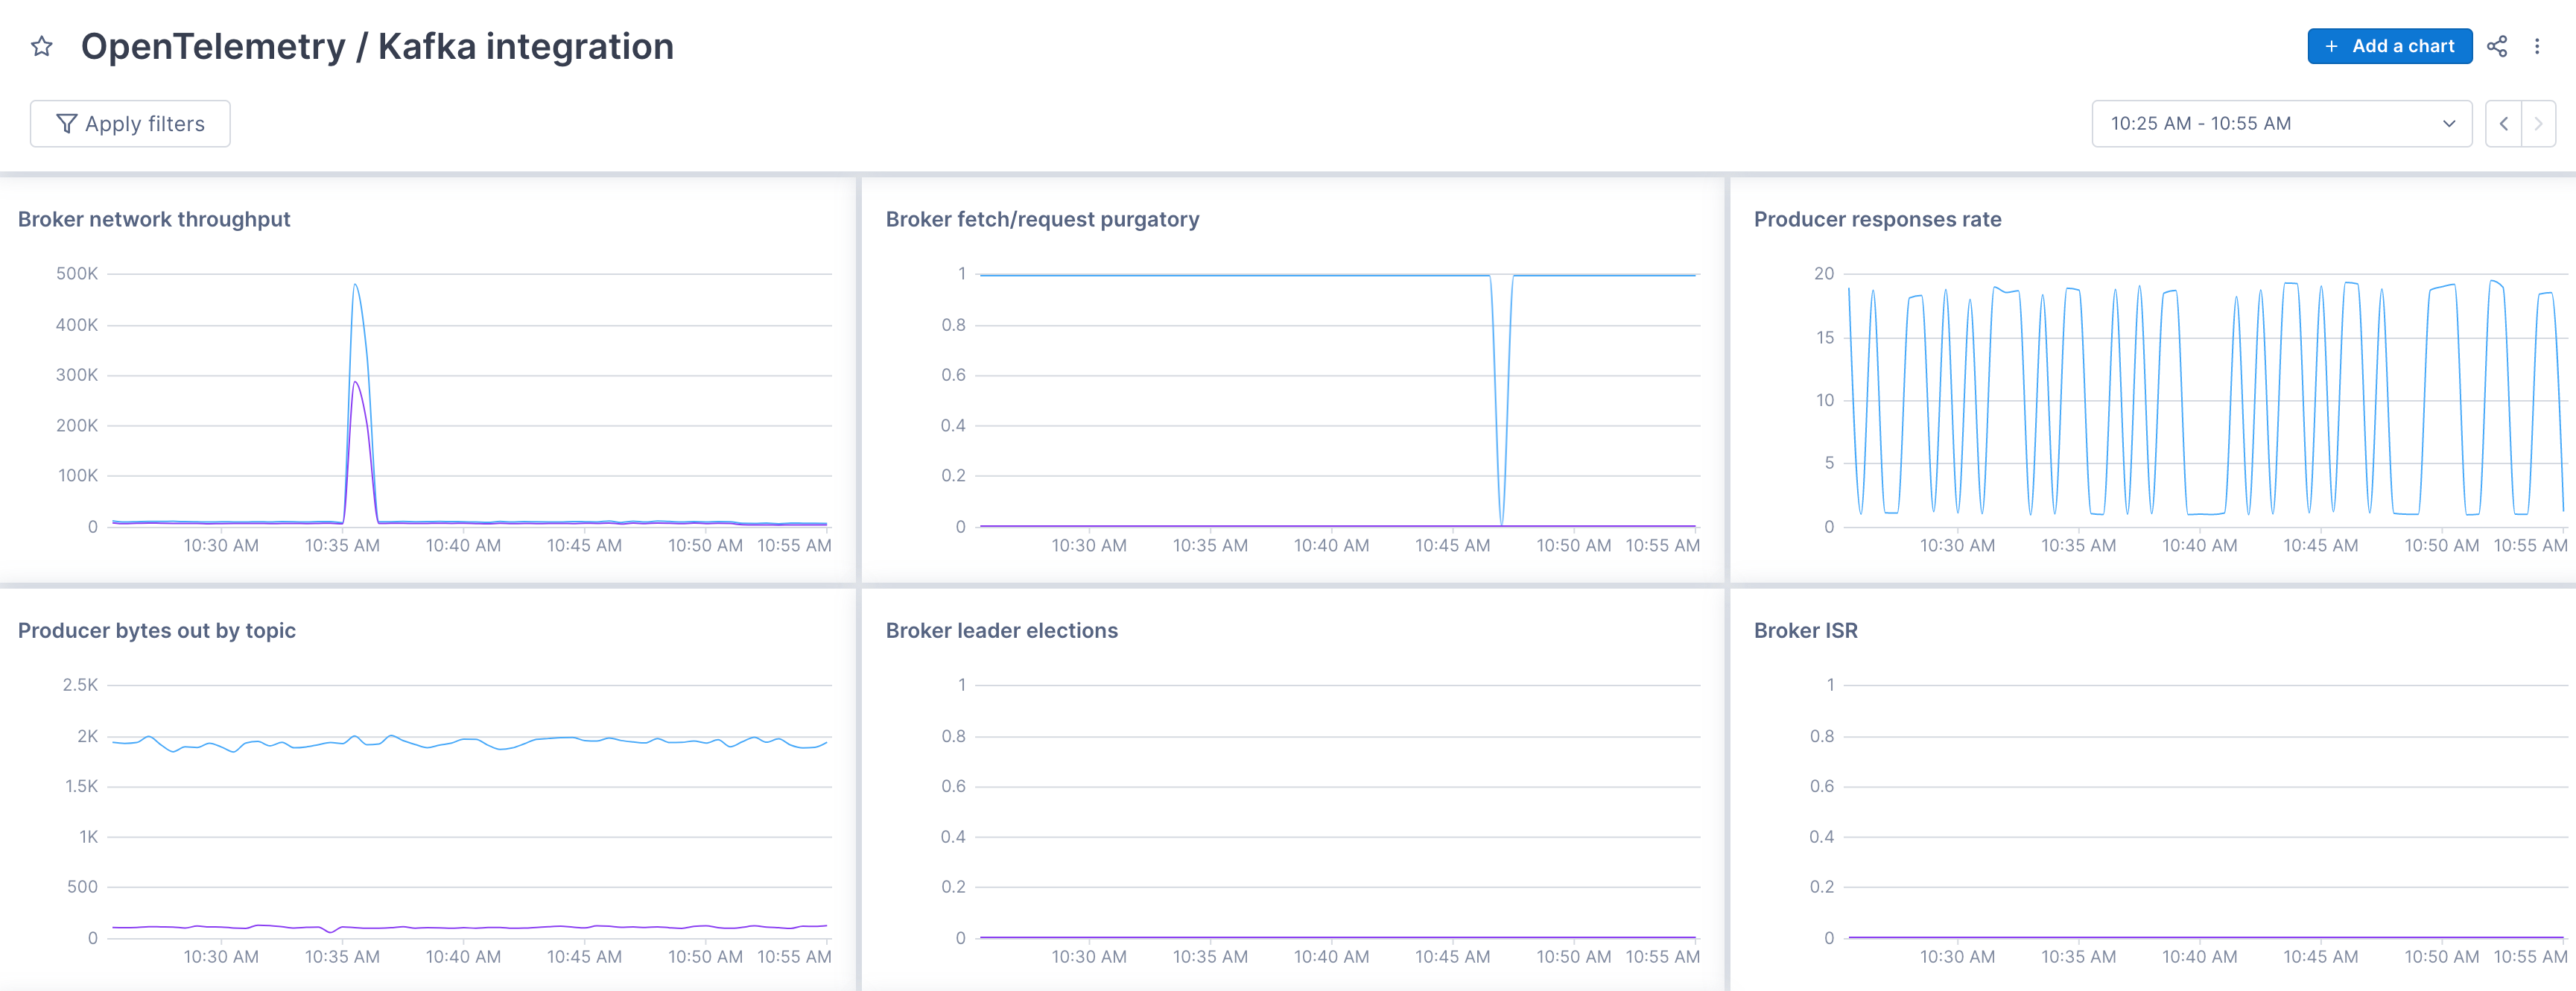
See also
Updated Dec 1, 2022