Telegraf provides an integration for monitoring network endpoints using the Net Response plugin. Telegraf generates metrics based on the response it receives from sending a message to the endpoint. It converts the result to a metric that it then sends to Cloud Observability using the OpenTelemetry output plugin.
To complete the integration, you will:
- Configure Telegraf to ingest endpoint status metrics using the Net Response plugin
- Configure the OpenTelemetry output plugin
Configure the Telegraf Net Response plugin
In the Telegraf configuration file, add configuration for the address and network protocol. Other options vary, depending upon whether you use UDP or TCP. You can find complete details on the plugin’s features and configuration in the official Net Response plugin documentation.
This example configuration below uses UDP, which provides the send and response feature.
1
2
3
4
5
6
[[inputs.net_response]]
  protocol = "udp"
  address = "demosvc:9876"
  send = "yolo"
  expect = "up"
  timeout = "2s"
Configure the OpenTelemetry output plugin
To deliver metrics to Cloud Observability you configure the Telegraf OpenTelmetry output plugin. This plugin sends metrics to Cloud Observability using gRPC.
This example shows the plugin configured without TLS:
1
2
3
4
5
6
7
8
[[outputs.opentelemetry]]
  service_address = "ingest.lightstep.com:443" # US data center
  # service_address = "ingest.eu.lightstep.com:443" # EU data center
  insecure_skip_verify = true

  # Additional gRPC request metadata
  [outputs.opentelemetry.headers]
    lightstep-access-token = "$LS_ACCESS_TOKEN"
For more details regarding configuring the OpenTelemetry output plugin see the official Telegraf documentation.
Validate metrics are reporting to Cloud Observability
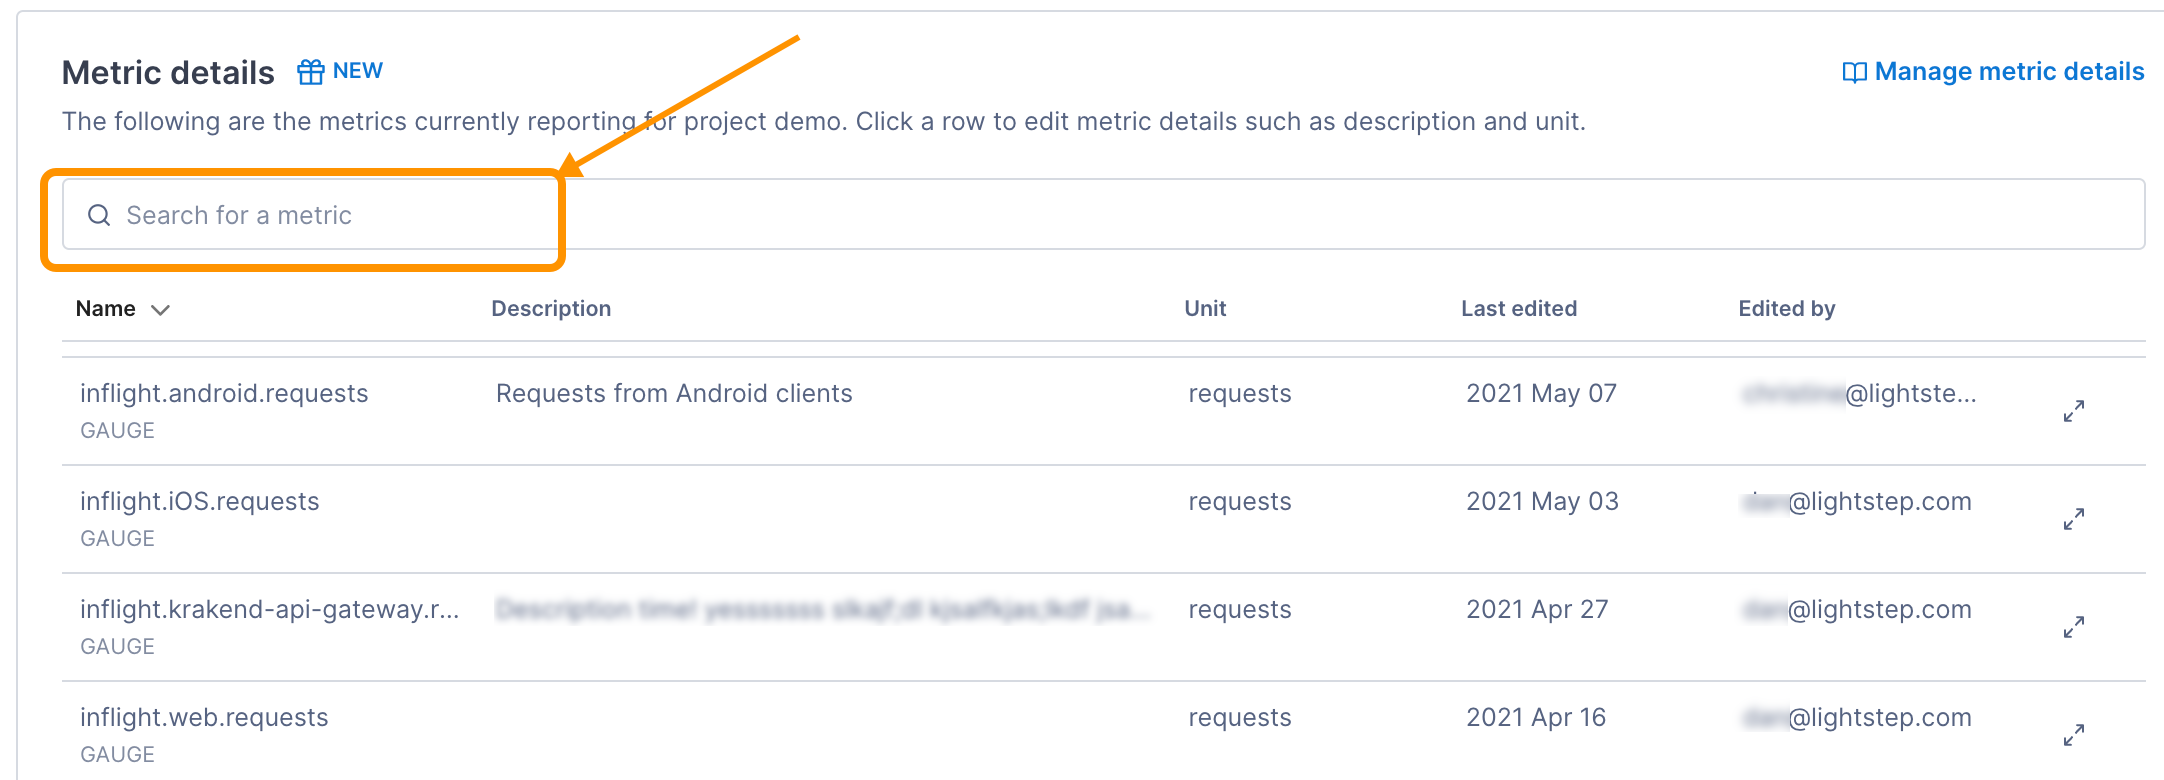
You can validate that metrics are reporting to Cloud Observability on the Metrics details page in Settings.
-
In Cloud Observability, click Settings > Metric details.
-
Search for Net Response metric names.

See the Net Response input plugin documentation for a complete list of emitted metrics.
-
If needed, select the metric to edit the description and how the units are displayed in Cloud Observability.
View metrics in Cloud Observability
Once you have Cloud Observability ingesting metrics from the Net Response, you can use the Cloud Observability Terraform Provider to create a dashboard for the metrics.
Additional resources
-
For a complete example that’s ready to run, see Telegraf Net Response input plugin in the Cloud Observability OpenTelemetry Examples.
-
You can learn more about configuring Telegraf from the official documentation.
See also
Updated Dec 1, 2022
