
The OpenTelemetry Collector provides a vendor-agnostic agent for receiving, processing, and exporting telemetry data. It eliminates the necessity to operate and maintain multiple agents, resulting in enhanced scalability. It also supports open-source observability data formats (such as Jaeger, Prometheus, Fluent Bit, etc.), which can be sent to one or more open-source or commercial back-ends.
The Collector can be run as a local agent or as a centralized data collection Gateway as a standalone service.
If you’re using Kubernetes we recommend using the OpenTelemetry Operator to automate the management of your fleet of Collectors. The Operator automatically gathers cluster metrics, handles auto-scaling, and more. We recommend following our Quickstart for Kubernetes to get started.
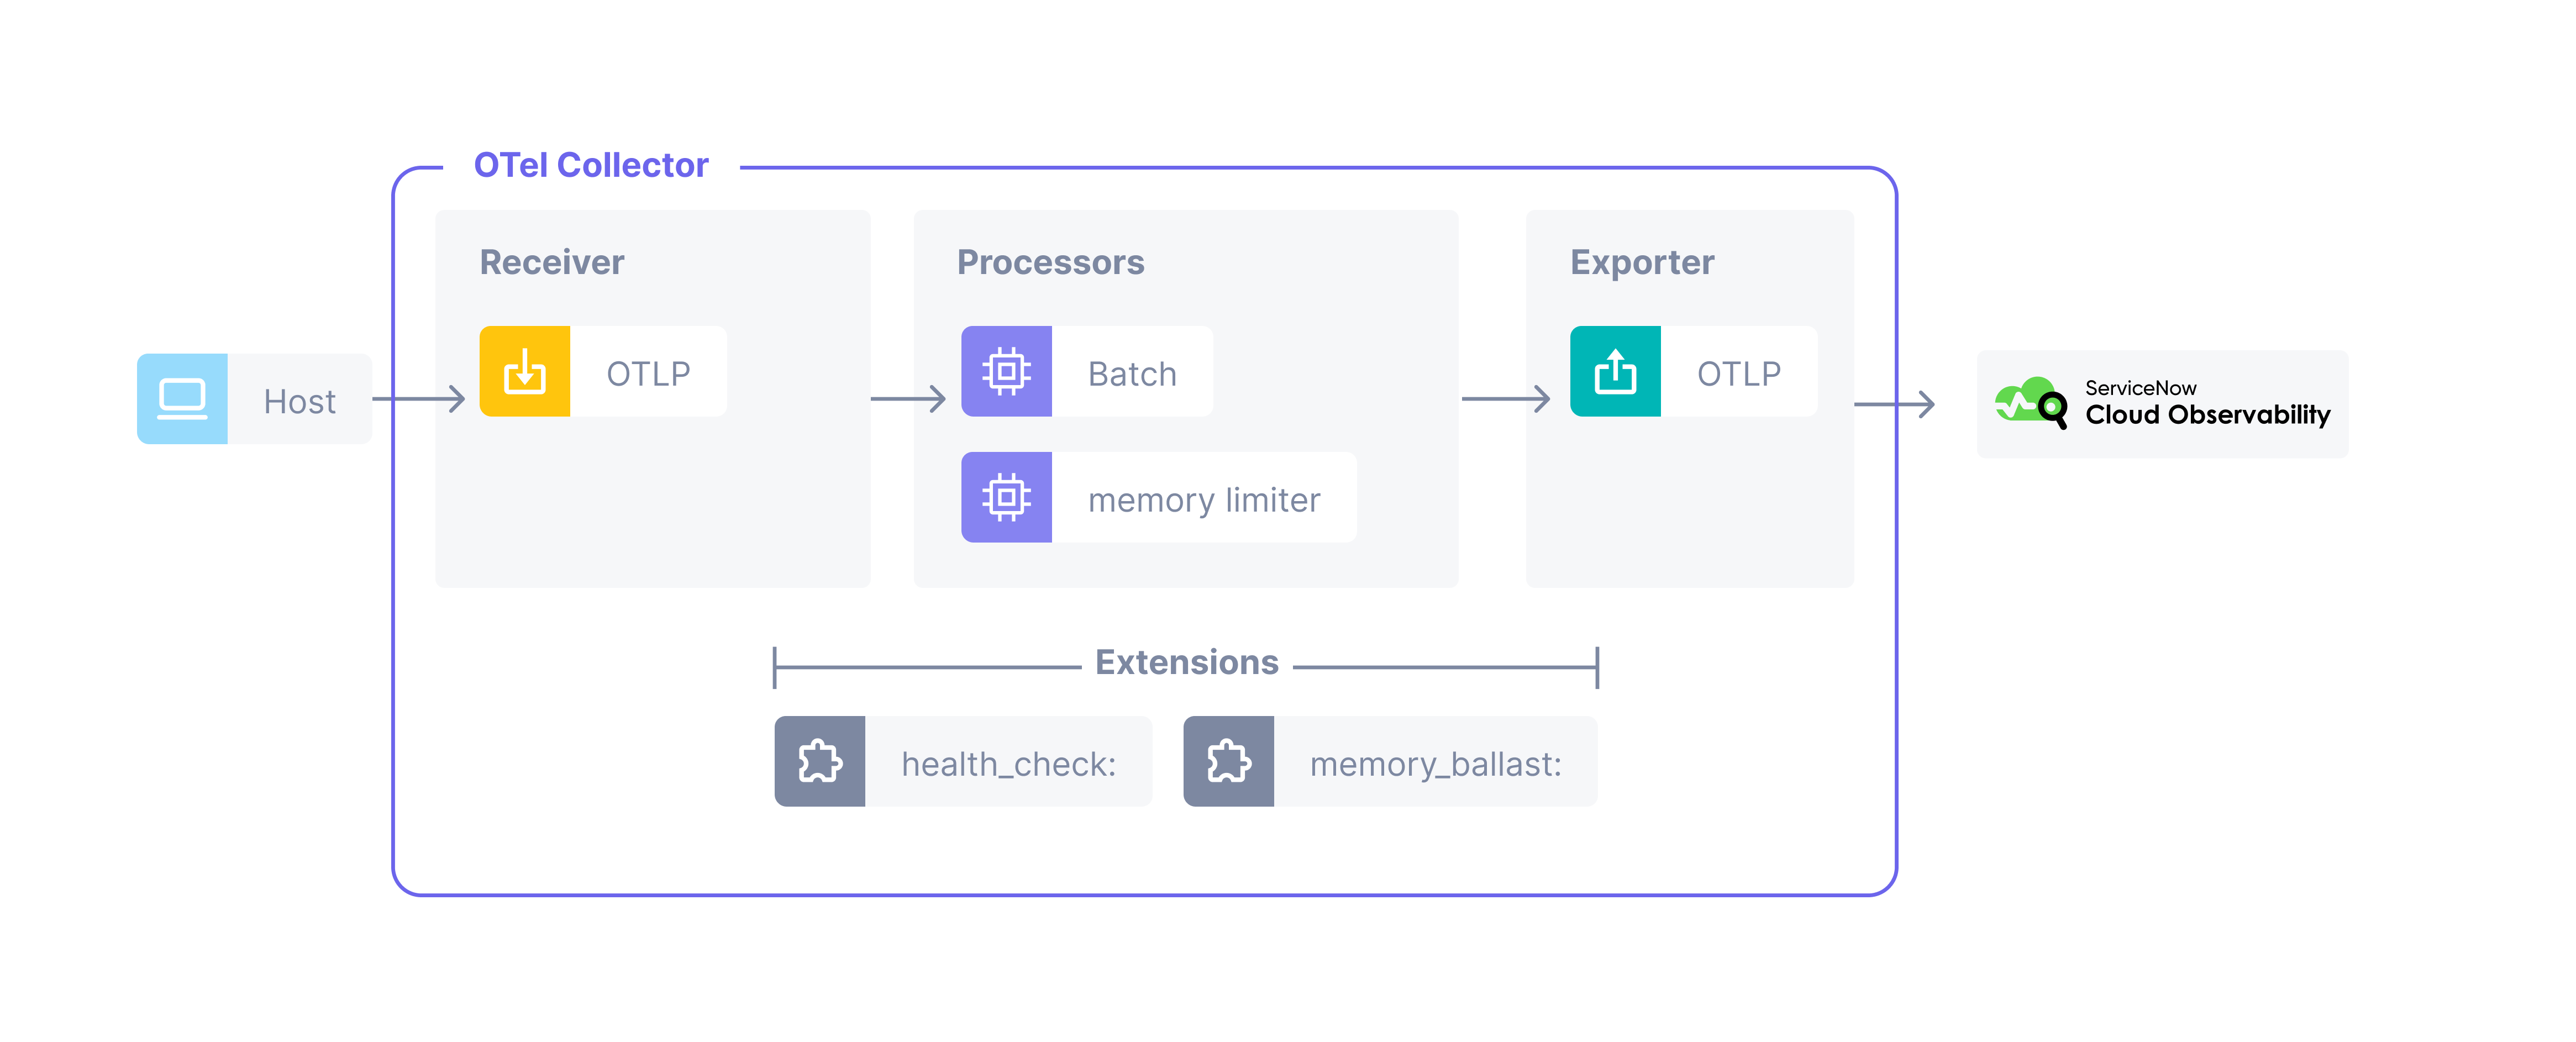
The Collector configuration file has 5 main sections:
Receivers: push or pull based components that get data into the CollectorProcesors: optional components that can transform data from the receivers or exportersExporters: push or pull based components that send data from the Collector to your configured destinationsExtensions: optional components that do not primarily involve processing telemetry data like Collector health monitoring, service discovery, and more.Service: enables the components that were configured in the other sections. If a component isn’t in the Service section then it isn’t used.
Related Cloud Observability Documentation:
- Quickstart Kubernetes: Collector and Operator
- Update a pre-existing Collector to send data to Cloud Observability
- Tutorial: Use the Collector for application data using Docker
- Cloud Observability’s default recommended Collector configuration
- Monitor your Collectors using a pre-built dashboard
Related Community Resources:
See also
General guidelines for configuring Collectors
Updated Jun 6, 2025