
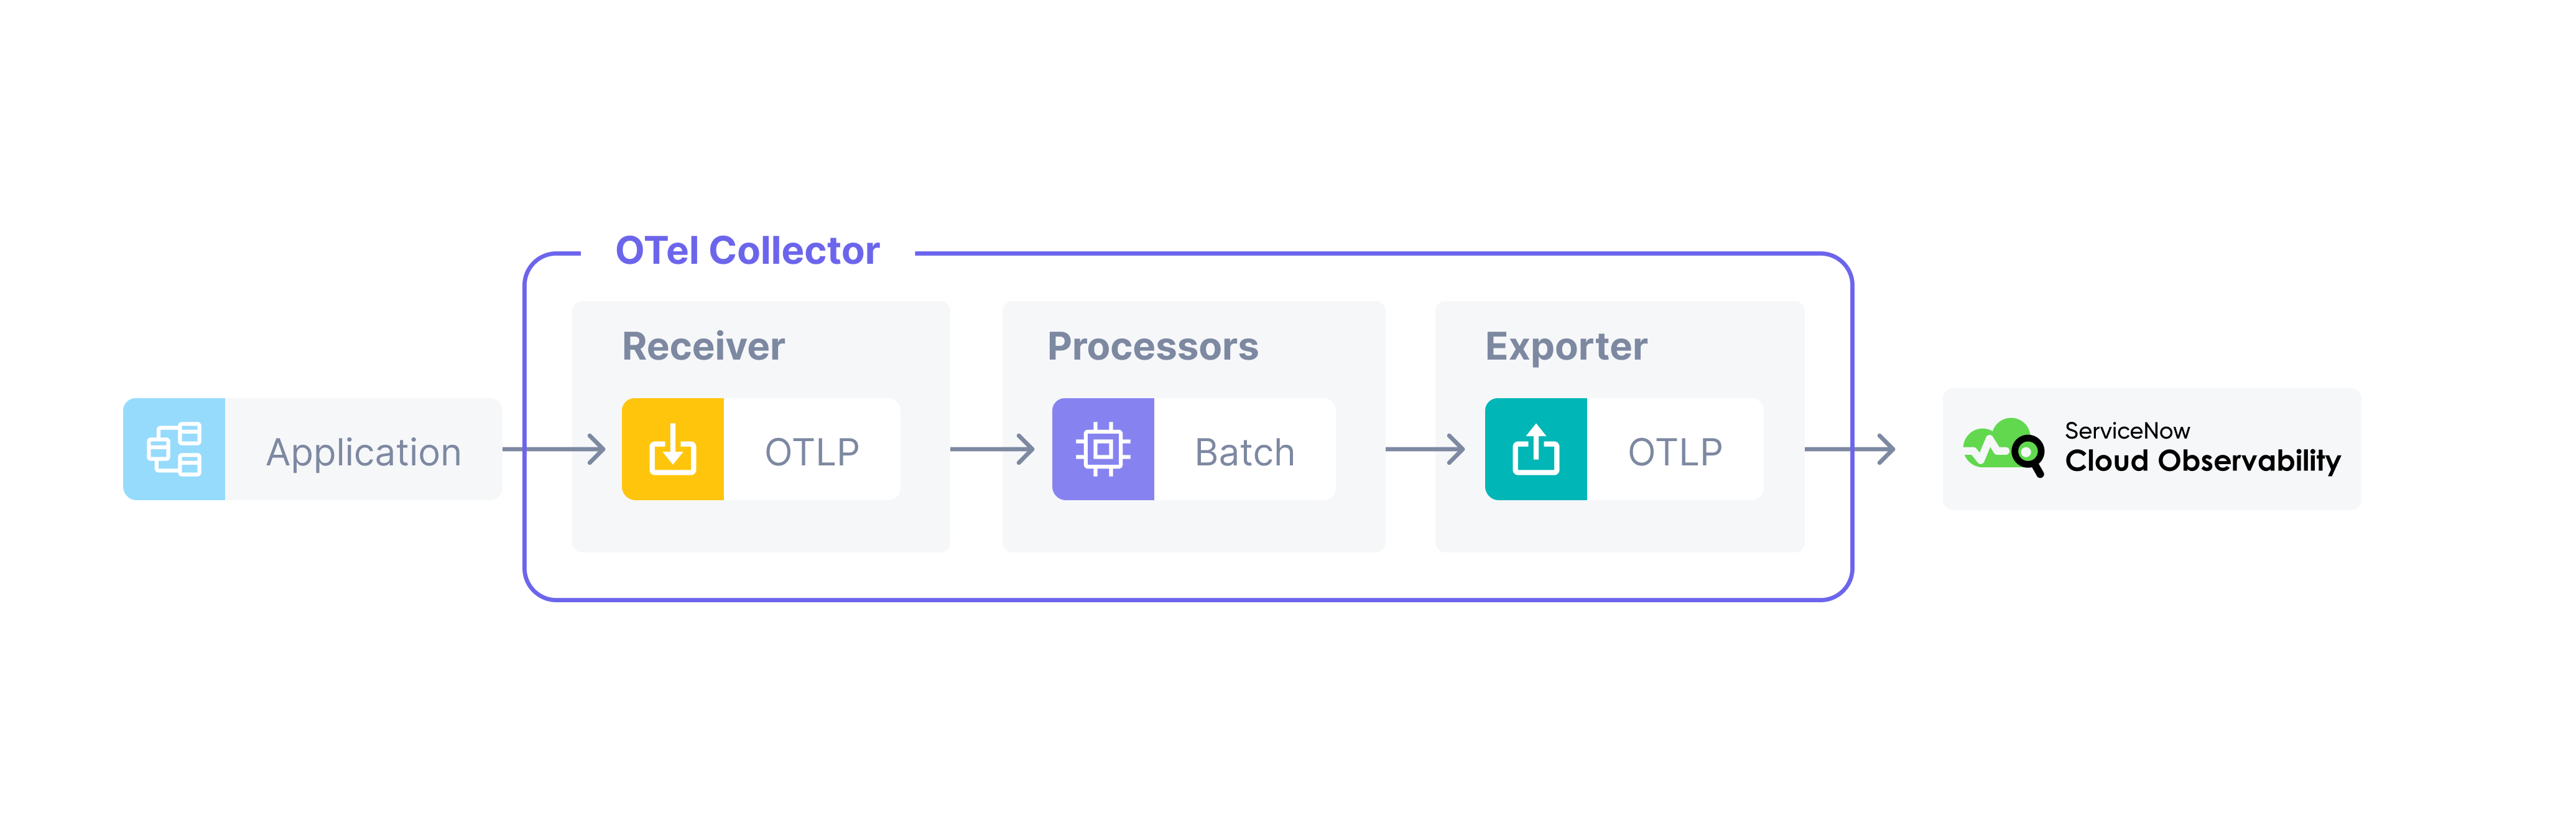
This tutorial demonstrates how to use the OpenTelemetry Collector to send application telemetry to Cloud Observability.
You will run a simple containerized application locally that will send trace data to a local containerized instance of the OpenTelemetry Collector, that will in turn send the trace data to Cloud Observability.
For more on the OpenTelemetry Collector, see the official OpenTelemetry docs.
If you’re deploying the collector in Kubernetes, we recommend using the Kubernetes Operator.
For sending metrics to Cloud Observability using the OpenTelemetry Collector, see Ingest metrics using the OpenTelemetry Collector.
Pre-Requisites
- Docker and Docker Compose
- A Cloud Observability account.
- A Cloud Observability access token for the Cloud Observability project you would like to use.
Tutorial: Running the OpenTelemetry Collector Locally
-
Clone the OpenTelemetry Examples repo.
1
 git clone https://github.com/lightstep/opentelemetry-examples.git
-
Save the following file as
otelcol-lightstep.yml.1 2 3 4 5 6 7 8 9 10 11 12 13 14 15 16 17 18 19 20 21 22 23 24 25 26 27 28 29 30 31 32 33 34 35 36 37 38 39
# validated with collector-contrib v0.90.0 receivers: prometheus: config: scrape_configs: - job_name: 'otel-collector' scrape_interval: 5s static_configs: - targets: ['0.0.0.0:8888'] otlp: protocols: grpc: http: processors: batch: exporters: debug: verbosity: normal otlp/ls: endpoint: ingest.lightstep.com:443 # US data center # endpoint: ingest.eu.lightstep.com:443 # EU data center headers: "lightstep-access-token": "${LIGHTSTEP_ACCESS_TOKEN}" service: telemetry: metrics: address: ":8888" pipelines: traces: receivers: [otlp] processors: [batch] exporters: [debug, otlp/ls] metrics: receivers: [prometheus, otlp] processors: [batch] exporters: [debug, otlp/ls]
Replace
${LIGHTSTEP_ACCESS_TOKEN}with your own Cloud Observability Access Token, and save the file. The access token tells what Cloud Observability project to send your telemetry data to.A few noteworthy items:
- The Collector can ingest data using both HTTP and gRPC. The
receiversconfiguration may appear to be empty; however, it actually means that we are using the defult values for thereceiversconfig. It is actually the equivalent of:
1
2
3
4
5
6
7
 receivers:
   otlp:
     protocols:
       grpc:
         endpoint: 0.0.0.0:4317
       http:
         endpoint: 0.0.0.0:4318
- Cloud Observability ingests data in native
OpenTelemetry Protocol (OTLP)format, theOTLP Exporteris used. The exporter can be called eitherotlpor follow the naming formatotlp/<something>. In this example, theotlp/<something>format is added for clarity, to indicate that we are using OTLP to send data to Cloud Observability. - Though not mandatory, we are also using a
Logging Exporter. This is helpful, as it prints our traces to the Collector’sstdout. In this case it’s your terminal. - We must define a pipeline in the
service.pipelinessection of the YAML config. Specifically, we need to define a pipeline for our traces. The pipeline tells the Collector:- Where it’s getting trace data from (it’s being sent via OTLP)
- If there’s any processing that needs to be done (this is optional)
- Where to send data to. In our case, it’s to
stdout(via theLogging Exporter) and to Cloud Observability (viaOTLP Exporter)
If you find that you can’t see data in Cloud Observability, make sure that you’ve defined a pipeline, and that the pipeline’s exporter (for example
service.pipelines.traces.exporters) lists yourotlp/lsexporter. - The Collector can ingest data using both HTTP and gRPC. The
-
Launch the Collector.
First, set up Docker networking. This is a one-time setup, and is done so that our sample app container can talk to the OpenTelemetry Collector container.
Open a new terminal window in the
opentelemetry-examplesfolder, and run the following commands:1
docker network create --driver=bridge -o "com.docker.network.bridge.enable_icc"="true" otel-collector-demo
Now, in the same terminal window run the Collector. Note how it is using the newly-created
otel-collector-demonetwork.1 2 3 4 5 6 7 8 9 10
docker run -it --rm \ -p 4317:4317 \ -p 4318:4318 \ -v $(pwd)/collector/vanilla/otelcol-lightstep.yaml:/otel-config.yaml \ --network="otel-collector-demo" \ -h otel-collector \ --name otel-collector \ otel/opentelemetry-collector-contrib:0.96.0 \ "/otelcol-contrib" \ "--config=otel-config.yaml"
A few noteworthy items about the above command. It:
- Exposes the OpenTelemetry Collector’s gRPC port (
4317) and HTTP port (4318) for ingesting data in OTLP format. Code instrumented with OpenTelemetry will be in the OTLP format. - Maps the local
otelcol-lightstep.ymlfile that you modified earlier, to theotel-config.yamlfile in the container’s internal filesystem - Tells the OpenTelemetry Collector where to look for config YAML file via
the
--configflag.
Ensure that you are running the
dockercommand from theopentelemetry-examplesfolder. - Exposes the OpenTelemetry Collector’s gRPC port (
-
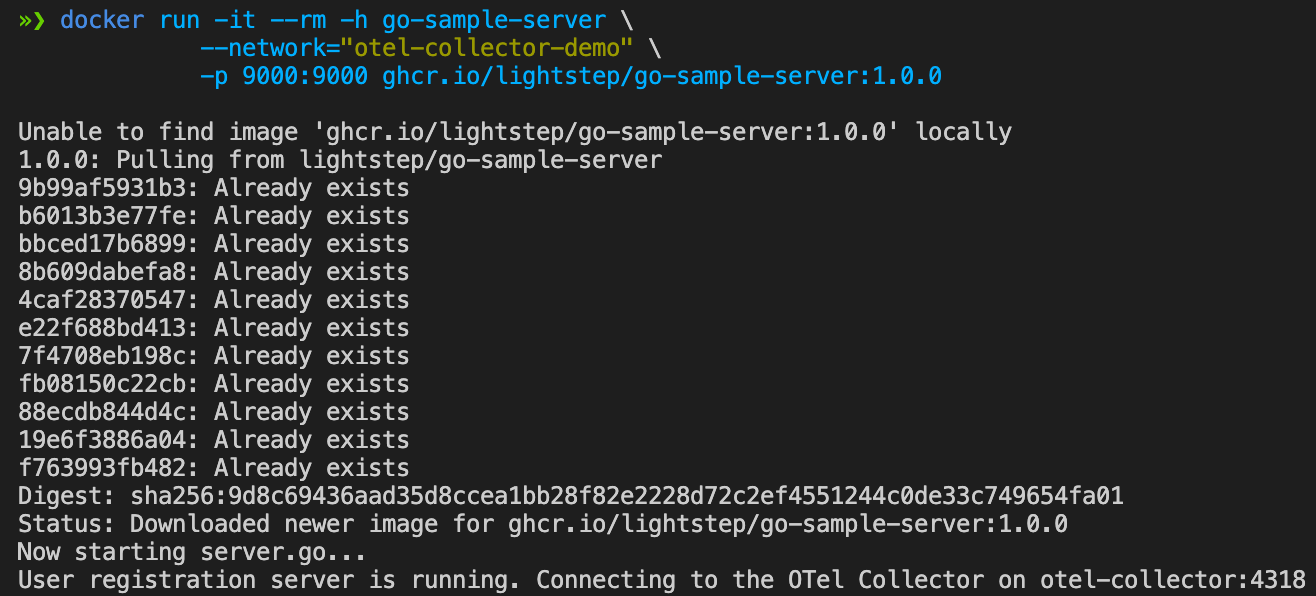
Launch the sample app.
Open a new terminal window and run the command below. Note how we are using the same network here as we did for the OpenTelemetry Collector,
otel-collector-demoso that the app can reach the Collector.1 2 3
docker run -it --rm -h go-sample-server \ --network="otel-collector-demo" \ -p 9000:9000 ghcr.io/lightstep/go-sample-server:1.0.0
You should see output that looks something like this:
-
Call the service.
Open a new terminal window, and run the following:
1
 curl http://localhost:9000
You should see output that looks something like this:

When you return to the terminal window running the OpenTelemetry Collector, you’ll notice that the Logging Exporter has printed your trace to
stdout: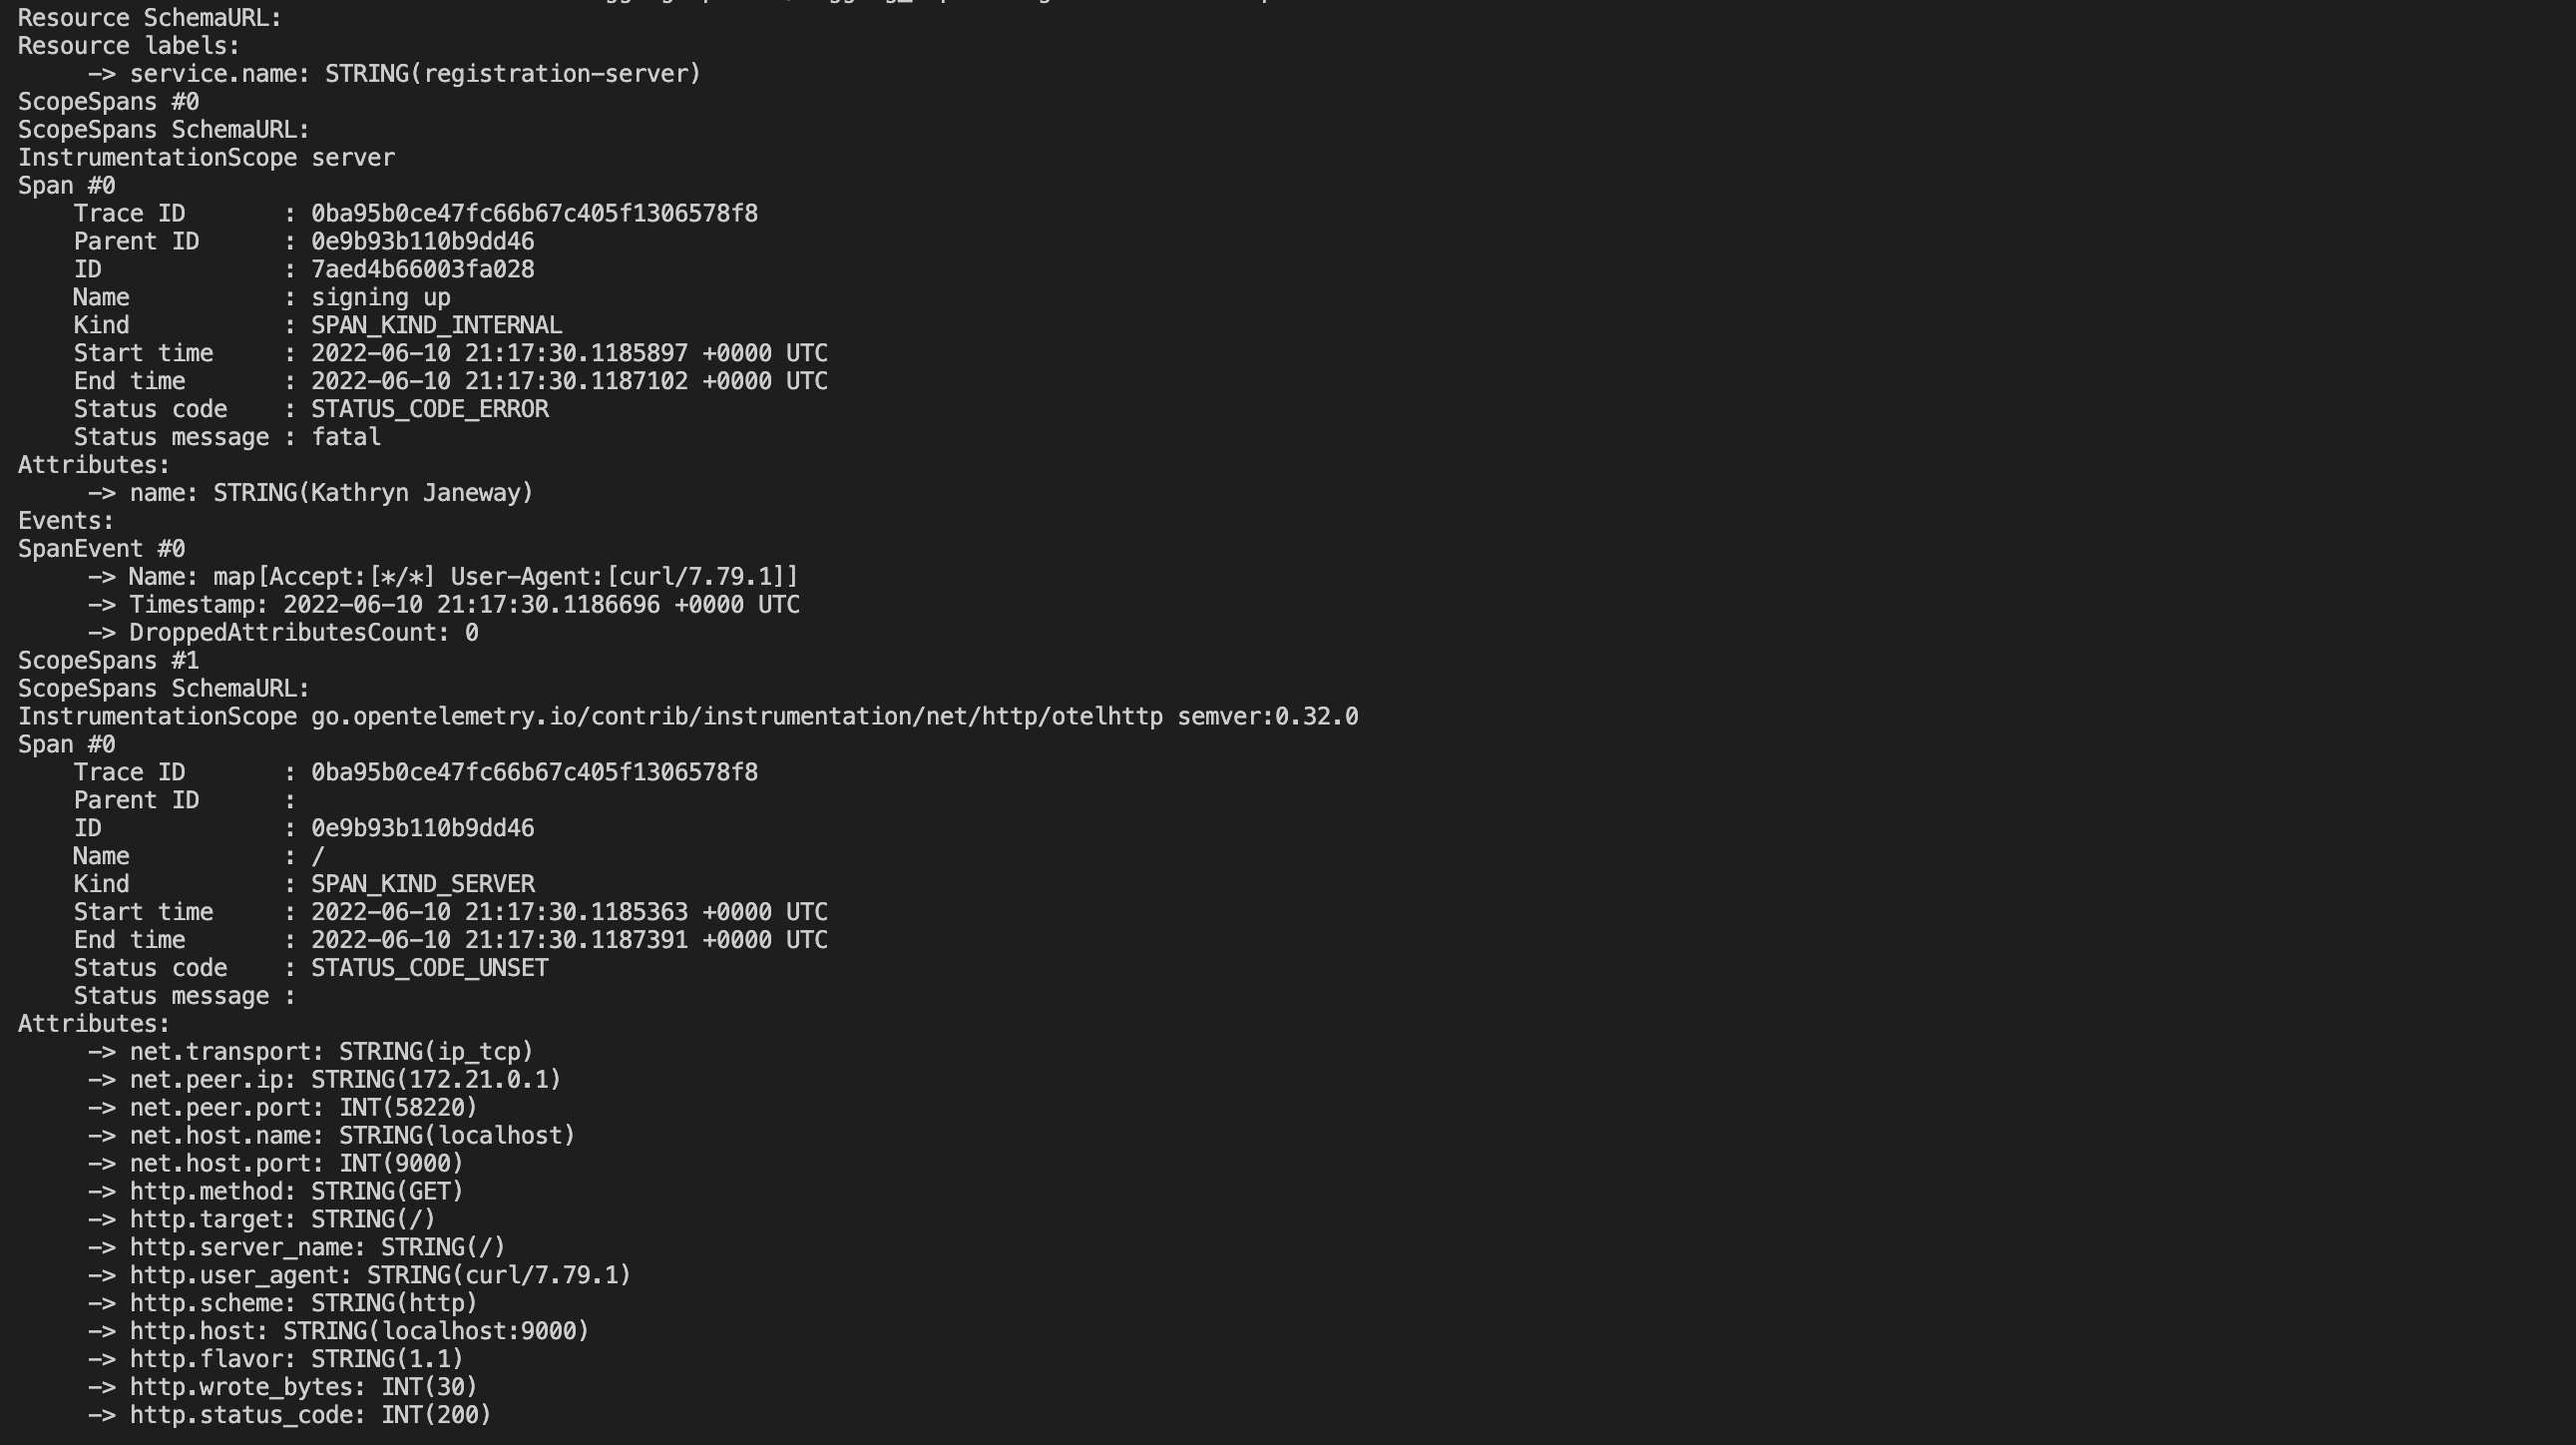
When you return to the terminal windows running the sample app, you’ll notice the following new output:

-
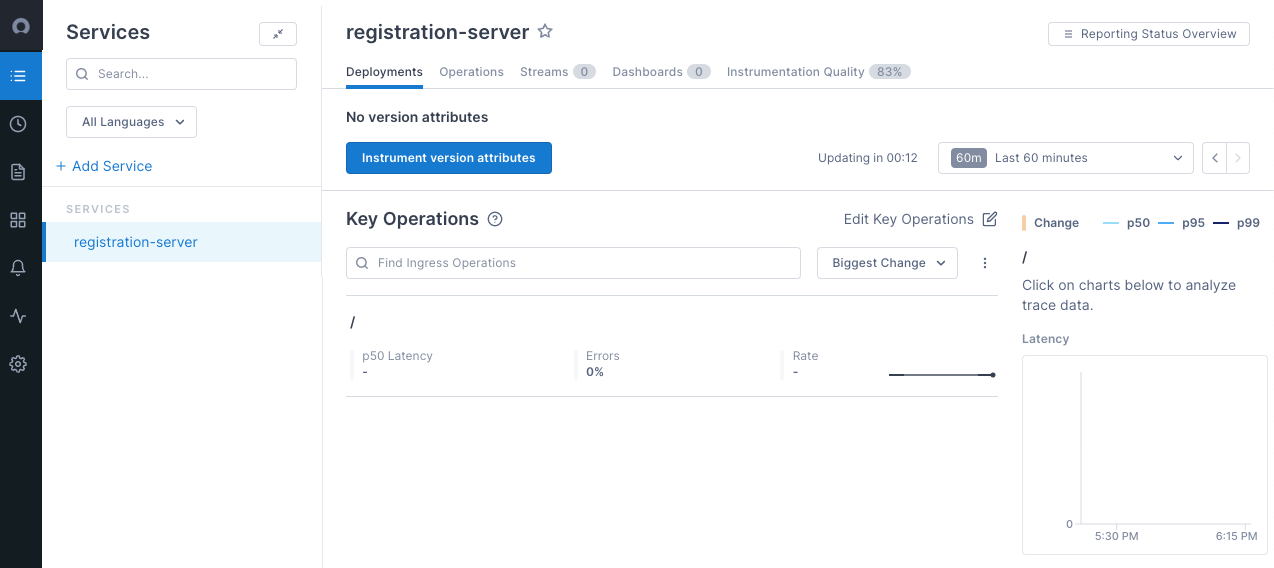
See the Traces in Cloud Observability.
Log into Cloud Observability. You’ll be able to see the services listed in the Service Directory.
To view traces in your Cloud Observability project, click Explorer in the left navigation bar, and then click on any span in the Trace Analysis table.
For a more detailed trace exploration, check out Cloud Observability Notebooks.
You can monitor your Collectors running in Kubernetes using the pre-built dashboard.
Troubleshooting
The first thing you should do when troubleshooting collector issues is make sure data from your network can reach Cloud Observability. Your firewall or cloud configuration may be preventing a connection.
The default OTLP Exporter from a Collector enables gzip compression and TLS.
Depending on your network configuration, you may need to enable or disable
certain other gRPC features. This
page
contains a complete list of configuration parameters for the Collector gRPC
client.
In the event that you are unable to establish a connection to the Cloud Observability
platform, you can use curl to verify HTTP/2 connectivity to our collectors.
Run the following command, replacing <YOUR_ACCESS_TOKEN> with your project’s
access token:
1
2
curl -D- -XPOST --http2-prior-knowledge -H "lightstep-access-token: <YOUR_ACCESS_TOKEN>" https://ingest.lightstep.com/access-test # US data center
# curl -D- -XPOST --http2-prior-knowledge -H "lightstep-access-token: <YOUR_ACCESS_TOKEN>" https://ingest.eu.lightstep.com/access-test # EU data center
You should see the following output, or something similar:
1
2
3
4
5
6
7
HTTP/2 200
content-length: 2
content-type: text/plain
date: Thu, 09 May 2024 15:39:14 GMT
server: envoy

OK
If you do not see this output, or the request hangs, then something is blocking HTTP2 traffic from transiting your network to ours.
If you see HTTP/2 401, your request succeeded, but your token was not accepted.
Some things to check:
- Validity of your access token.
- Ensure proxies are passing through the
lightstep-access-tokenheader.
Alternatively, to exercise the full gRPC request/response cycle, you can try emitting a single span to your project using the otel-cli tool. Refer to this example image and commands for running the CLI tool in Kubernetes and Docker on GitHub. Only send test spans to a non-production project.
For additional troubleshooting recommendations, see Troubleshooting Missing Data in Cloud Observability.
See also
Use the OpenTelemetry Collector
Updated Nov 22, 2023