
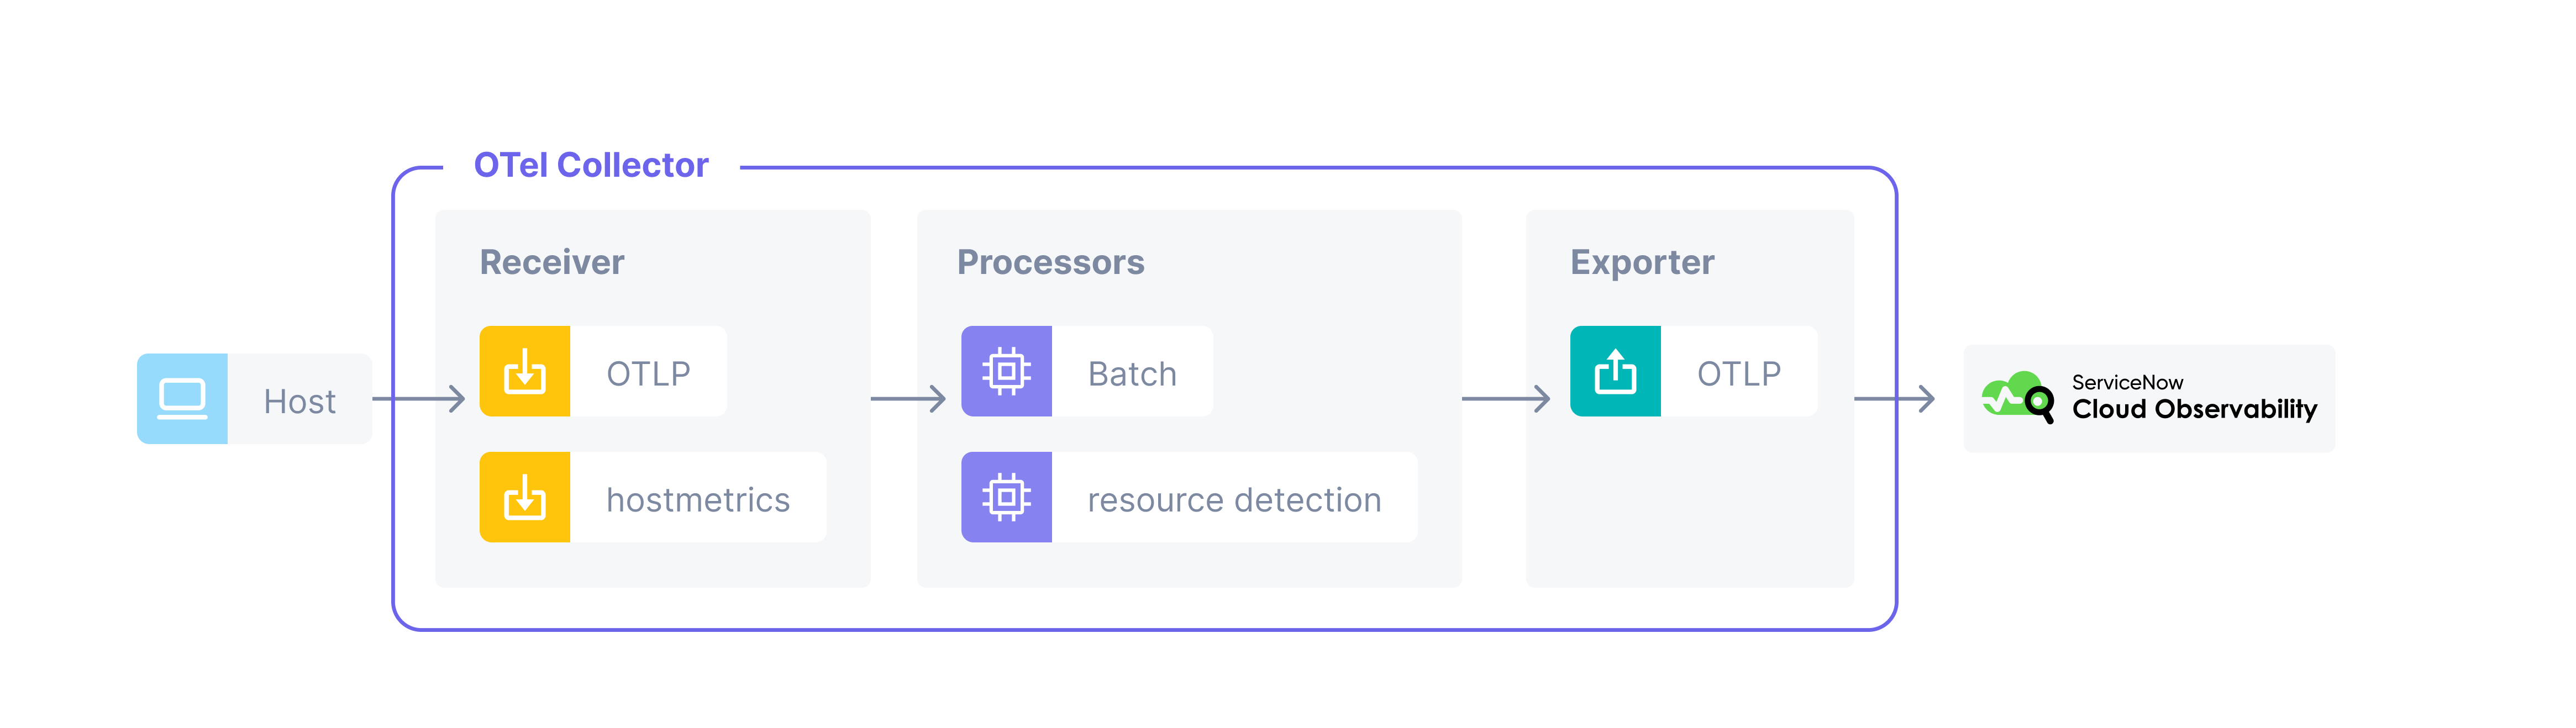
This quickstart demonstrates how to use the OpenTelemetry Collector to send infrastructure metric data to Cloud Observability.
You will run a local containerized instance of the OpenTelemetry Collector that
collects and sends host telemetry data using a Collector
Receiver to
Cloud Observability.
If you’re deploying the collector in Kubernetes, we recommend following our Kubernetes Quickstart.
For more on the OpenTelemetry Collector, see the official OpenTelemetry docs.
Pre-Requisites
- Docker and Docker Compose
- A Cloud Observability account.
- A Cloud Observability access token for the Cloud Observability project you would like to use.
Configure the Collector to send host telemetry data to Cloud Observability
-
Clone the OpenTelemetry Examples repo.
1
 git clone https://github.com/lightstep/opentelemetry-examples.git
-
Edit the OpenTelemetry Collector Config file.
1
 cd opentelemetry-examples
Open
collector/vanilla/collector.yamlfor editing using your favorite editor.It’s recommended that you make a copy of this file
collector.yamland save it asotelcol-lightstep.yaml.The file looks like this:
1
2
3
4
5
6
7
8
9
10
11
12
13
14
15
16
17
18
19
20
21
22
23
24
25
26
27
28
29
 receivers:
   otlp:
     protocols:
       grpc:
       http:

 exporters:
   logging:
     logLevel: debug
   otlp/ls:
     endpoint: ingest.lightstep.com:443 # US data center
     # endpoint: ingest.eu.lightstep.com:443 # EU data center
     headers:
       "lightstep-access-token": "${LIGHTSTEP_ACCESS_TOKEN}"

 processors:
   batch:

 service:
   pipelines:
     traces:
       receivers: [otlp]
       processors: [batch]
       exporters: [logging, otlp/ls]

     metrics:
         receivers: [otlp]
         processors: [batch]
         exporters: [logging,otlp/ls]
Replace
${LIGHTSTEP_ACCESS_TOKEN}with your own Cloud Observability access token, and save the file. The access token tells what Cloud Observability project to send your telemetry data to. -
Add the host metrics
receiverto the Collector configUpdate the
otelcol-lightstep.yamlfile and add a host metricsreceiverunder the receivers section. The scrapers designate which metrics to collect and from where. In this example we’re telling the scraper to collect metrics from our system’s cpu, load, memory, etc.Your receiver snippet should look like this:
1
2
3
4
5
6
7
8
9
10
11
12
13
14
15
16
17
 receivers:
     otlp:
         protocols:
         grpc:
         http:

     hostmetrics:
         collection_interval: 10s
         scrapers:
             cpu:
             load:
             memory:
             disk:
             filesystem:
             network:
             paging:
             processes:
-
Configure your Collector metrics pipeline.
Now add the
hostmetricsreceiver to your Collector metrics pipeline. In thereceiversarray of the metrics pipeline addhostmetricsnext to the existing entry. Your metric pipeline snippet should look like:1 2 3 4
metrics: receivers: [hostmetrics,otlp] processors: [batch] exporters: [logging,otlp/ls]
Your final
otelcol-lightstep.yamlfile should look like the following:1 2 3 4 5 6 7 8 9 10 11 12 13 14 15 16 17 18 19 20 21 22 23 24 25 26 27 28 29 30 31 32 33 34 35 36 37 38 39 40 41 42 43 44 45
# validated on Linux with collector-contrib v0.88.0 receivers: prometheus: config: scrape_configs: - job_name: 'otel-collector' scrape_interval: 5s static_configs: - targets: ['0.0.0.0:8888'] hostmetrics: collection_interval: 10s scrapers: cpu: load: memory: disk: network: paging: processes: processors: resourcedetection/system: detectors: ["system"] system: hostname_sources: ["os"] batch: exporters: logging: verbosity: normal otlp/ls: endpoint: ingest.lightstep.com:443 # US data center # endpoint: ingest.eu.lightstep.com:443 # EU data center headers: "lightstep-access-token": "YOUR-ACCESS-TOKEN" service: telemetry: metrics: address: ":8888" pipelines: metrics: receivers: [prometheus, hostmetrics] processors: [batch, resourcedetection/system] exporters: [logging, otlp/ls]
-
Launch the Collector.
Open a new terminal window in the
opentelemetry-examplesfolder and run the following command:1 2 3 4
docker run --rm \ -v "$(pwd)/collector/vanilla/otelcol-lightstep.yaml":/collector.yaml \ --name otelcol otel/opentelemetry-collector-contrib:latest \ --config collector.yaml
After running the Collector the metrics will start appearing within 5 minutes. Give yourself a well earned short break in the meantime, you deserve it.
-
See metrics in Cloud Observability.
Log into Cloud Observability.
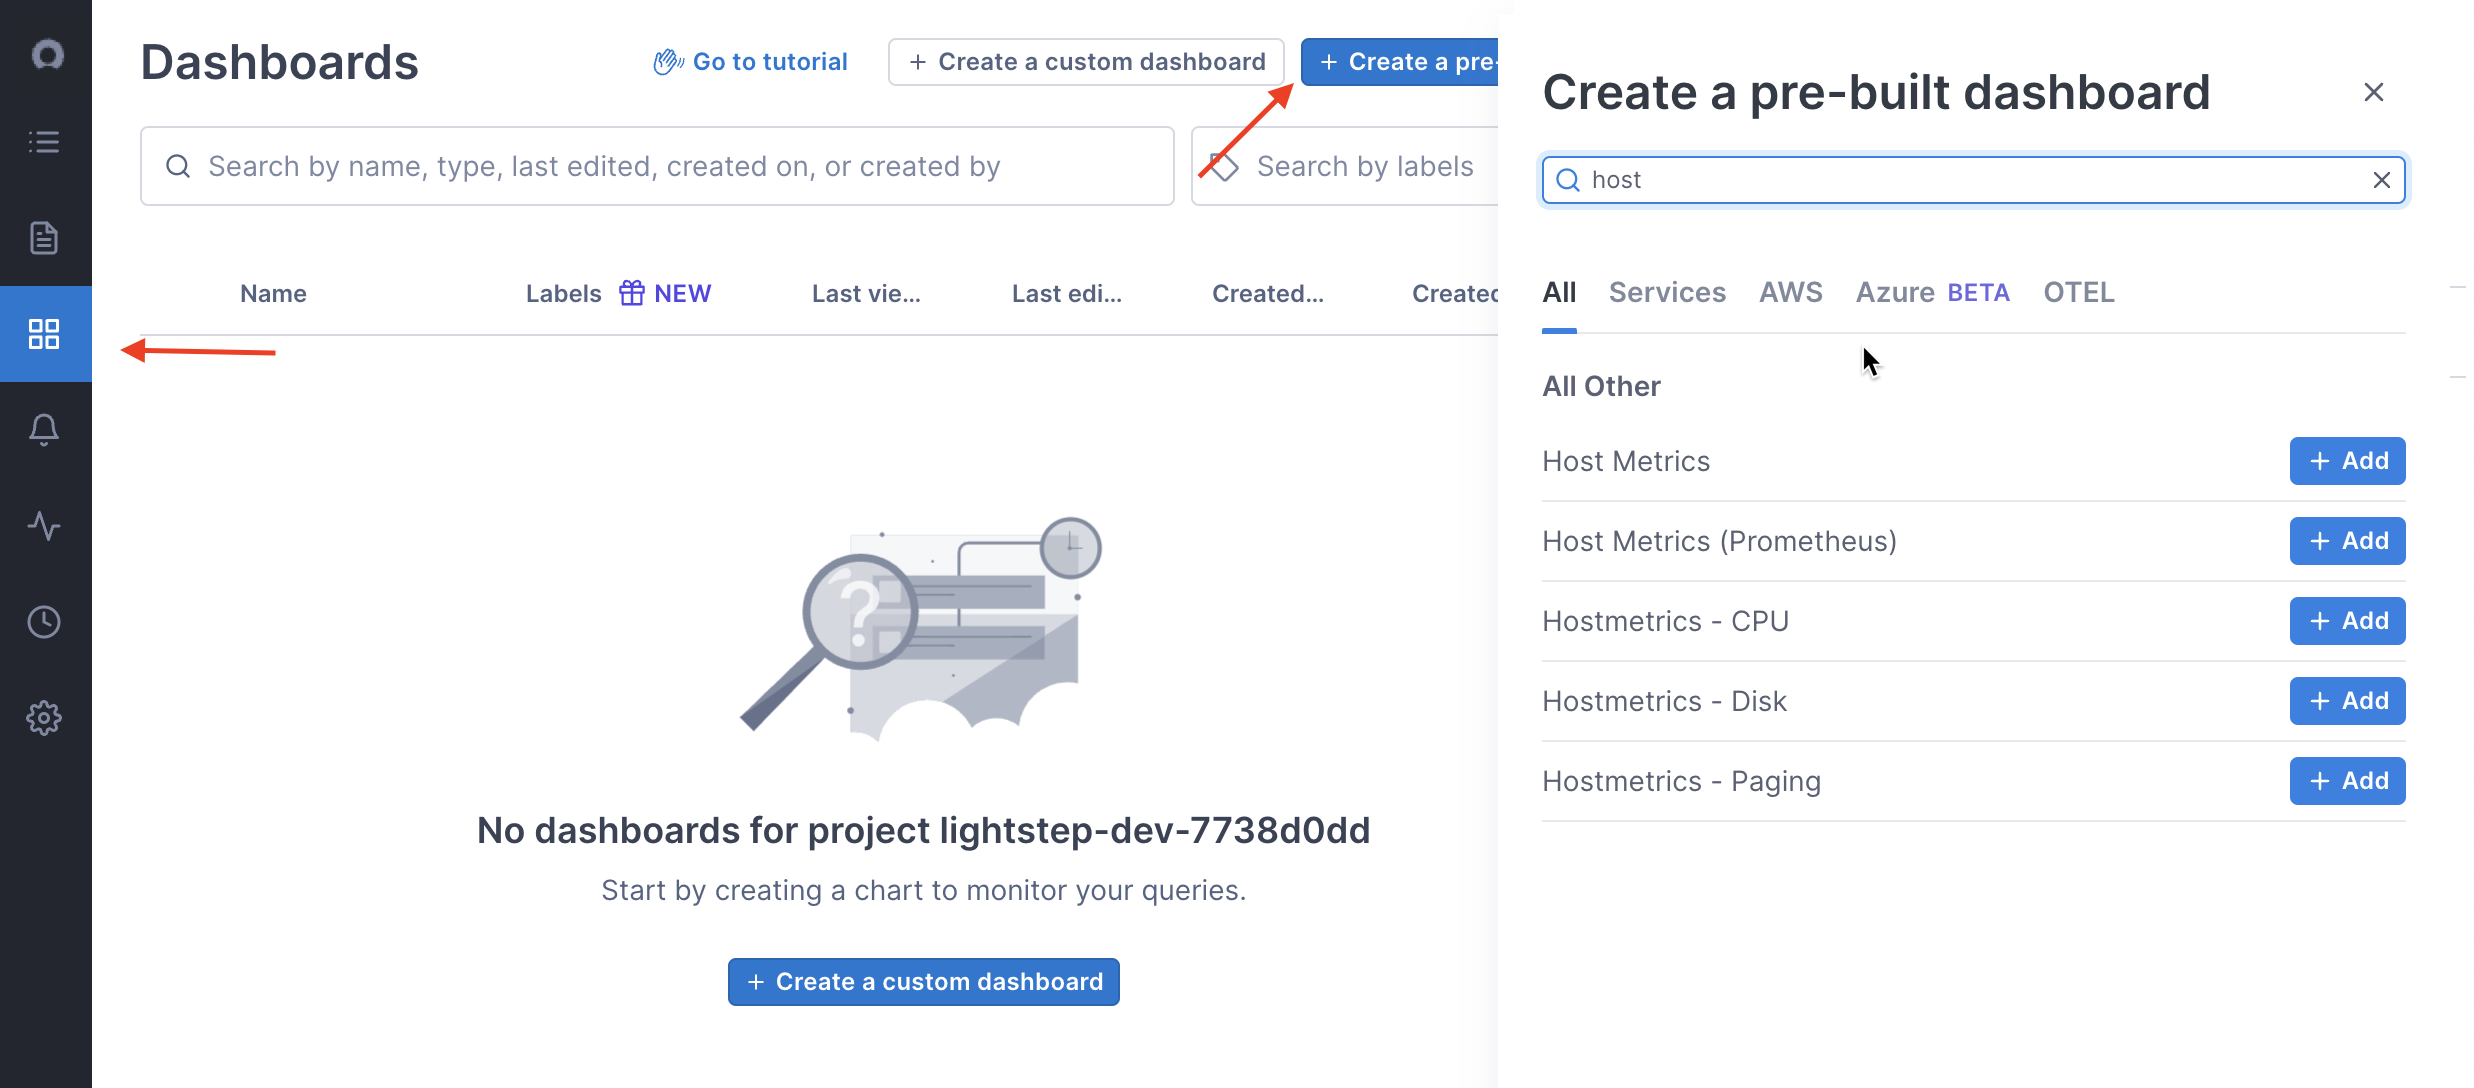
To view metrics in your Cloud Observability project, click notebooks or dashboards in the left navigation bar.
When using notebooks you can click on any host metrics in the
all
 telemetry
dropdown. All operating systems don’t report all host metrics. Check thesystem.cpu.timemetric first, as all operating systems report this.There are also several different pre-built dashboards available for host metrics. Select the dashboard tile in the UI, click Create a pre-built dashboard, and choose the dashboard you’re interested in.
-
Enrich your host metrics.
You may notice that the metrics don’t have many relevant attributes. You can enhance your host metrics using a
resource detectorto capture resource information from your resources and add that to all of your metrics.In the
processorssection, add theresourcedetectionandsystemdetector:1 2 3 4
processors: batch: resourcedetection: detectors: [system]
And in your metric pipeline processor section:
1
2
3
4
 metrics:
     receivers: [hostmetrics]
     processors: [batch,resourcedetection]
     exporters: [logging,otlp/ls]
-
Re-launch the Collector.
Once your metrics are flowing you should see the same metrics in your notebook or dashboard but with more attributes to filter on like
host.name,host.idandos.type.This is just the first step. OpenTelemetry offers dozens of infrastructure receivers you can use and configure out of the box. Visit the Integrations search page and use the filters at the top to view Collector integrations, and then browse or search for data to ingest.
You can monitor your Collectors running in Kubernetes using the pre-built dashboard.
See also
Use the OpenTelemetry Collector
Updated Nov 22, 2023