This Quickstart will have you configure your tracer to communicate with the Cloud Observability Microsatellites and create a single span on your service. You install the Cloud Observability tracer and then use the Cloud Observability API to instrument your code.
While Cloud Observability offers tracers and APIs specific to its tracing software, you will still use the OpenTracing API to fully instrument your code. Be sure you have read and are familiar with both Cloud Observability tracers and the OpenTracing specification in your application’s language.
PHP Instrumentation for OpenTracing
- Find your access token in Cloud Observability. You’ll need this to configure your Cloud Observability tracer.
- Click the Project Settings button.
- In the Access Tokens table, click the Copy icon to copy your access token to the clipboard.
-
Install the Cloud Observability tracer.
Using composer:1
composer require lightstep/tracer
The
lightstep/tracerpackage is available on packagist.org. - Also using composer, include the Cloud Observability tracer in
composer.json1 2 3 4 5
{ "require": { "lightstep/tracer": "^1.0" } }
-
In your application, configure the Cloud Observability tracer and register it as the OpenTracing global tracer. As part of the configuration, you need to add your access token and add your service’s name.
1
2
3
require __DIR__ . '/vendor/autoload.php';

$tracer = LightStep::initGlobalTracer('YOUR_SERVICE_NAME', 'YOUR_ACCESS_TOKEN');
-
Test that everything is connected by sending a test span. Annotate the span by adding a tag (key/value pair) and logs, then flush the tracer.
1
2
3
4
5
6
7
8
9
 $span = LightStep::startSpan("trivial/loop");
 for ($i = 0; $i < 10; $i++) {
     $span->infof("loop_iteration %d", $i);
     echo "The current unix time is " . time() . "
     ";
       sleep(.1);
 }
 $span->finish();
 exit();
-
Run your app.
- Open Cloud Observability. You should see your service in the Service directory list.
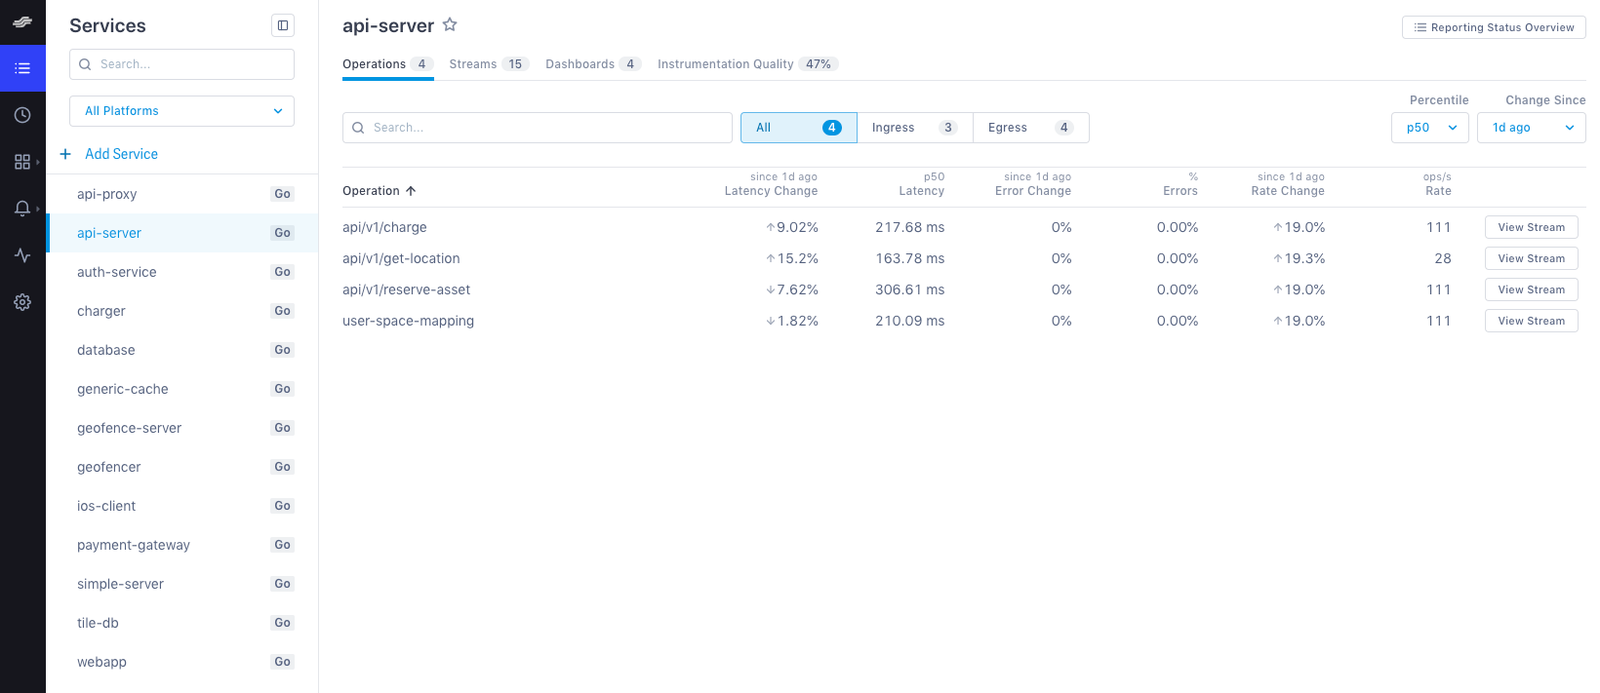
It may take a few moments for your service to display in the Service Directory. To see data immediately, click the Explorer tab to view data in the histogram.
Read the Lightstep PHP API docs to learn more.
See also
Measure your instrumentation quality
Updated Mar 2, 2020