Follow these steps to configure your tracer to communicate with the Lightstep Microsatellites and create a single span on your service. You install both the OpenTracing API and Lightstep tracer and then use the OpenTracing and Lightstep APIs to instrument your code.
While Lightstep offers tracers and APIs specific to its tracing software, you will still use the OpenTracing API to fully instrument your code. Be sure you have read and are familiar with both Lightstep tracers and the OpenTracing specification in your application’s language.
Ruby Instrumentation for OpenTracing
-
Find your access token in Lightstep. You’ll need this to configure your Lightstep tracer.
-
Click the Project Settings button.
-
In the Access Tokens table, click the Copy icon to copy your access token to the clipboard.
-
-
Add the Lightstep tracer and OpenTracing to your Gemfile (if you don’t have a Gemfile yet, run
bundle initto create one). Runbundleto complete installation1 2
gem "opentracing" gem "lightstep"
-
Install.
1
bundle -
In your application, import the Lightstep tracer and OpenTracing API.
1
2
require "lightstep"
require "opentracing"
-
Early in your application’s initialization, configure the Lightstep tracer and register it as the OpenTracing global tracer. As part of the configuration, you need to add your access token and add your service’s name.
1
2
3
4
transport = LightStep::Transport::HTTPJSON.new(access_token: "YOUR_ACCESS_TOKEN")

tracer = LightStep::Tracer.new(component_name: "YOUR_SERVICE_NAME", transport: transport)
OpenTracing.global_tracer = tracer
-
Test that everything is connected by sending a test span. Annotate the span by adding a tag (key/value pair) and logs, then flush the tracer.
1
2
3
4
5
6
7
8
9
span = OpenTracing.start_span('first_span')
# for tag value, use either "client" or "server" depending on whether
# this service receives or creates requests
span.set_tag('kind', 'client')
span.log(event: 'what a lovely day')
span.finish()

# tracer.flush() will ensure that your span is sent
tracer.flush()
-
Run your app.
-
Open Lightstep. You should see your service in the Service directory list.
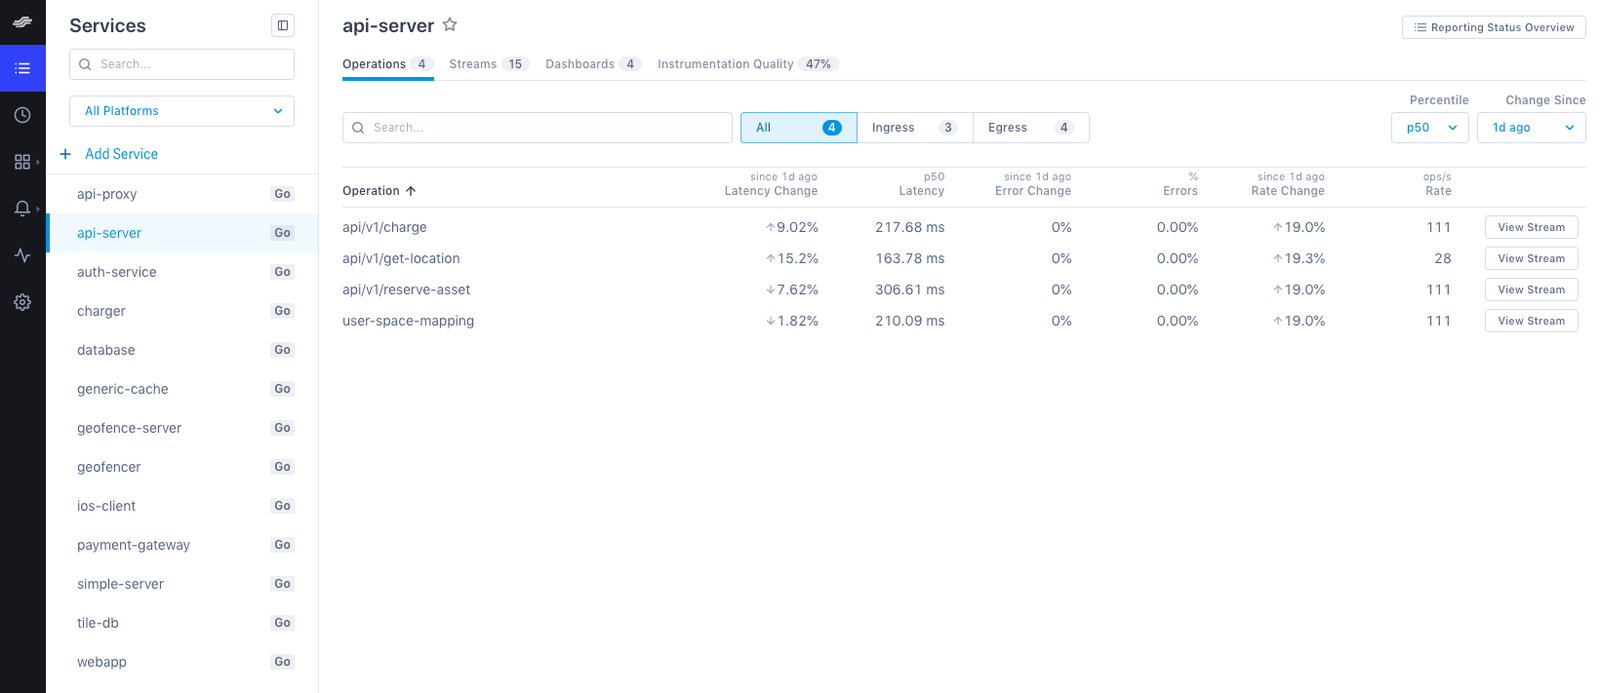
It may take a few moments for your service to display in the Service Directory. To see data immediately, click the Explorer tab to view data in the histogram.
Read the OpenTracing Ruby docs to learn more.
See also
Measure your instrumentation quality
Updated Mar 2, 2020