
If you want to use Cloud Observability to collect infrastructure metrics or application metrics in Prometheus format within a Kubernetes cluster environment, we recommend using the OpenTelemetry Collector with the Prometheus receiver. It is possible to run the collector and existing Prometheus server infrastructure side-by-side or use the OpenTelemetry Collector with Cloud Observability to replace Prometheus entirely.
This topic covers using the OpenTelemetry Collector in your Kubernetes cluster to ingest metrics in Prometheus format (also known as OpenMetrics) and assumes that you are running a single pod Prometheus in a Kubernetes cluster.
You can also deploy the Collector using a Kubernetes DaemonSet or a StatefulSet.
Read Plan an OpentTelemetry Collector deployment to determine which method to use.
You need to (in this order):
- Install the OpenTelemetry Operator and Cert Manager
- Configure the OpenTelemetry Collector to ingest Prometheus metrics
- Configure the Collector to scrape the metrics you need
These instructions install the OpenTelemetry Collector to a Kubernetes cluster as a single replica Kubernetes Deployment (also called “standalone” mode) using the OpenTelemetry Operator. If you’re interested in running a high-availability Collector (multiple replicas), please contact your Customer Success representative.
You must be able to run ValidatingWebhookConfigurations and MutatingWebhookConfigurations within your Kubernetes cluster; these are used to verify the Collector configuration.
Prerequisites
- Local install of Helm.
- A Cloud Observability access token.
Install the OpenTelemetry Operator and Cert Manager
-
Run the following command to add the following Helm respositories and pull the latest charts:
These Helm charts configure your environment (especially the Collector) to work best with Cloud Observability.
1
2
3
4
5
 helm repo add jetstack https://charts.jetstack.io
 helm repo add open-telemetry https://open-telemetry.github.io/opentelemetry-helm-charts
 helm repo add prometheus https://prometheus-community.github.io/helm-charts
 helm repo add lightstep https://lightstep.github.io/otel-collector-charts
 helm repo update
-
Next, install the cert-manager charts on your cluster. The Cert Manager manages certificates needed by the Operator to subscribe to in-cluster Kubernetes events.
1
2
3
4
5
6
 helm install \
     cert-manager jetstack/cert-manager \
     --namespace cert-manager \
     --create-namespace \
     --version v1.8.0 \
     --set installCRDs=true
-
Create a namespace for ServiceNow Cloud Observability
1
 kubectl create ns sn-cloud-obs
- Install the OpenTelemetry Operator chart. The Operator automates the creation and management of collectors, autoscaling, code instrumentation, scraping metrics endpoints, and more.
1
2
3
4
5
 helm install \
     opentelemetry-operator open-telemetry/opentelemetry-operator \
     -n sn-cloud-obs \
     --set "manager.collectorImage.repository=otel/opentelemetry-collector-k8s" \
     --version 0.56.0
- Run the following command to verify both charts successfully deployed with a status that says
deployed:1
helm list -A
Configure the OpenTelemetry Collector to Ingest Prometheus Metrics
Kubernetes has built-in support for hundreds of useful metrics that help teams understand the health of their containers, pods, nodes, workloads, and internal system components. Cloud Observability provides a Helm chart to automatically configure collectors to send these metrics to Cloud Observability.
-
Create a secret that holds your Cloud Observability Access Token.
1
2
 export LS_TOKEN='<your-token>'
 kubectl create secret generic otel-collector-secret -n sn-cloud-obs --from-literal="LS_TOKEN=$LS_TOKEN"
-
Install the
collector-k8schart. This chart automatically creates collectors to pull Kubernetes metrics and send them to your Cloud Observability project. We recommend you also specify the name of your cluster when installing the chart, which your can use by setting theclusterNamevariable:1 2 3 4
helm install kube-otel-stack lightstep/kube-otel-stack \ -n sn-cloud-obs \ --set metricsCollector.clusterName=your-cluster-name \ # --set otlpDestinationOverride="ingest.eu.lightstep.com:443" \ # EU data center
-
Verify the pods from the charts have been deployed with no errors:
1
 kubectl get pods
You should see pods for a node exporter, the operator, kube-state-metrics, and multiple collectors.
Configure the Collector to scrape a subset of metrics
Now that the Collector is available, you run a Cloud Observability Docker image in the namespace of your Prometheus server to extract and save the scrape_config file. An existing Prometheus server is required for this step.
- Check that your Prometheus pod is healthy and all containers are running.
Replace<namespace>and<prometheus pod name>with your Prometheus server’s namespace and pod name.1
% kubectl get pod -n <namespace> <prometheus pod name> - Run the following command to identify the pod ip address where your Prometheus server is running.
1
% kubectl get pods -n <namespace> <prometheus pod name> -o jsonpath='{.status.podIP}' - Extract and save your Prometheus configuration into
scrape_configs.yaml.
Replace<namespace>and<pod ip address>with your Prometheus server’s namespace and pod ip address.1
% kubectl run --rm --quiet -i -n <namespace> --image=lightstep/prometheus-config-helper:latest --env="PROMETHEUS_ADDR=<pod ip address>:9090" --restart=Never get-prometheus-scrape-configs > charts/collector_k8s/scrape_configs.yaml
Depending on the state of the Prometheus server, this may fail and leave the
scrape_configs.yamlfile empty. If it does, you may safely rerun the command. -
(Optional) Edit your
scrape_config.yamlto exclude any scrape targets you want to omit.
Use#to omit individual lines.
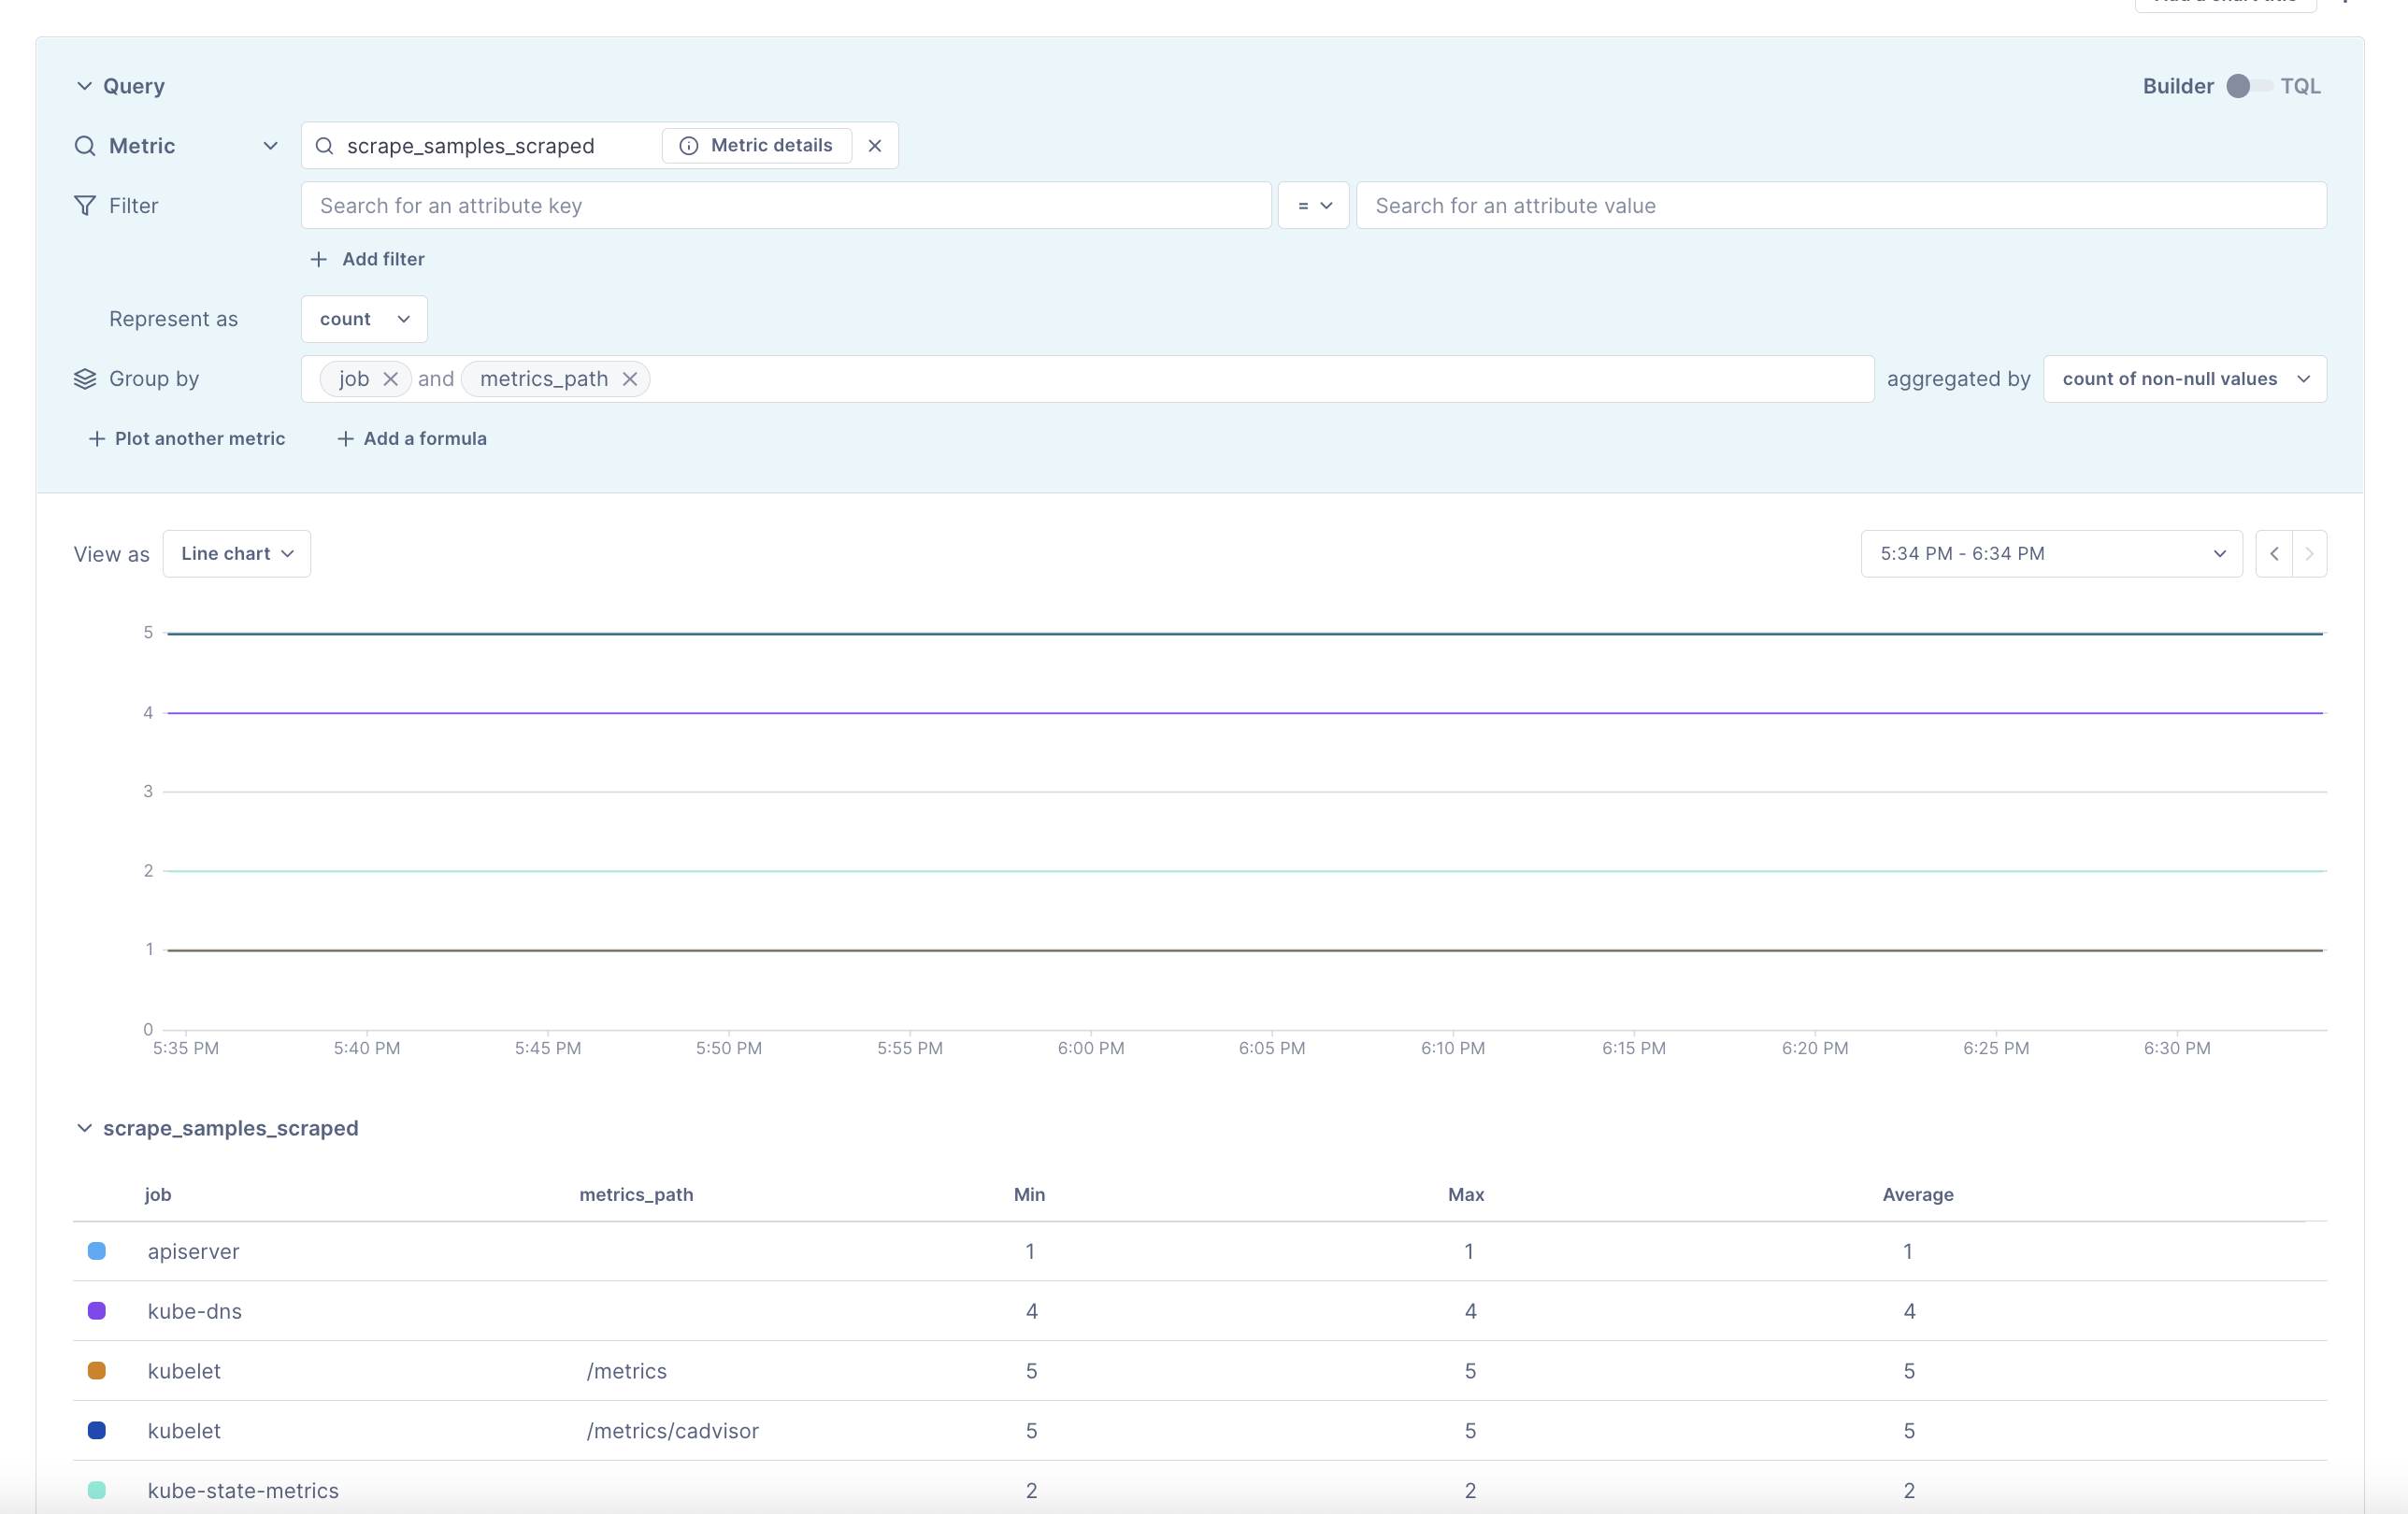
Once complete, upgrade the Collector’s chart provided by Cloud Observability’s example respository to incorporate the new changes. - Verify your scrape targets are appearing using Notebooks.
Collector Troubleshooting
The first thing you should do when troubleshooting collector issues is make sure data from your network can reach Cloud Observability. Your firewall or cloud configuration may be preventing a connection.
The default OTLP Exporter from a Collector enables gzip compression and TLS.
Depending on your network configuration, you may need to enable or disable
certain other gRPC features. This
page
contains a complete list of configuration parameters for the Collector gRPC
client.
In the event that you are unable to establish a connection to the Cloud Observability
platform, you can use curl to verify HTTP/2 connectivity to our collectors.
Run the following command, replacing <YOUR_ACCESS_TOKEN> with your project’s
access token:
1
2
curl -D- -XPOST --http2-prior-knowledge -H "lightstep-access-token: <YOUR_ACCESS_TOKEN>" https://ingest.lightstep.com/access-test # US data center
# curl -D- -XPOST --http2-prior-knowledge -H "lightstep-access-token: <YOUR_ACCESS_TOKEN>" https://ingest.eu.lightstep.com/access-test # EU data center
You should see the following output, or something similar:
1
2
3
4
5
6
7
HTTP/2 200
content-length: 2
content-type: text/plain
date: Thu, 09 May 2024 15:39:14 GMT
server: envoy

OK
If you do not see this output, or the request hangs, then something is blocking HTTP2 traffic from transiting your network to ours.
If you see HTTP/2 401, your request succeeded, but your token was not accepted.
Some things to check:
- Validity of your access token.
- Ensure proxies are passing through the
lightstep-access-tokenheader.
Alternatively, to exercise the full gRPC request/response cycle, you can try emitting a single span to your project using the otel-cli tool. Refer to this example image and commands for running the CLI tool in Kubernetes and Docker on GitHub. Only send test spans to a non-production project.
For additional troubleshooting recommendations, see Troubleshooting Missing Data in Cloud Observability.
See also
Prometheus concepts in Cloud Observability
Updated Jul 26, 2022