
The Cloud Observability platform combines logs, metrics, and traces to gain full observability into your system in one tool. Your dashboards and alerts now not only show you when there’s a problem, they become actionable tools that find the source of that problem for you. Changes in system behavior are mapped automatically to changes across service boundaries. You don’t need to know the dependencies in your system, Cloud Observability understands them and can find the issues deep in your stack.
To get started with Cloud Observability, import your system’s infrastructure, application, and cloud metrics, then use our Quickstarts to install OpenTelemetry. Once data is flowing into Cloud Observability, you can use notebooks; unified dashboards with logs, metrics, and spans; and RCA tools to obtain full observability.
Send logs to Cloud Observability
Send logs to Cloud Observability with tools such as Logstash, OpenTelemetry Collector, and Vector. Visit Log integrations for setup instructions, sample configurations, and more.
As of March 12, 2024, all non-logging customers have trial access to Cloud Observability logs. Use trial access to explore logging before committing to a full subscription. To get full access, contact Customer Success.
Send metrics to Cloud Observability
Cloud Observability supports metric data from many different sources. Read our integration guides to get started on a platform then search for specific metric integrations for detailed instructions, examples, and more.
Instrument your services
Cloud Observability supports OpenTelemetry to get telemetry data (logs, metrics, and traces) from your app as requests travel through its many services and other infrastructure.
If you’ve never instrumented for observability, read Understand Distributed Tracing for some background knowledge.
Use our Quick Starts to install OpenTelemetry and capture telemetry from popular libraries and frameworks.
Understand Microsatellites
Cloud Observability uses Microsatellites to collect 100% of the performance data that your tracing instrumentation generates. Microsatellites collect telemetry data generated by instrumented clients and servers, and then send that data to the Cloud Observability platform. The SaaS platform records aggregate information about the spans, directs the trace assembly process, and then stores traces durably, all for display in Cloud Observability.
Learn more about Microsatellites.
Microsatellites communicate with the instrumentation using an access token. Access tokens are project specific.
Understand changes using Cloud Observability
Once you have logs, metrics, and traces in Cloud Observability, you can use pre-built dashboards as a starting point for your monitoring. Service dashboards provide an overview of performance for a service, its operations, and if you’re ingesting Kubernetes metrics, the associated metrics that the service is emitting. Pre-built dashboards are also available for many metric integrations.
You can build custom dashboards using the Unified Query Builder or the UQL editor to monitor exactly what you need.
You can build corresponding alerts to be notified when meaningful deviations occur. 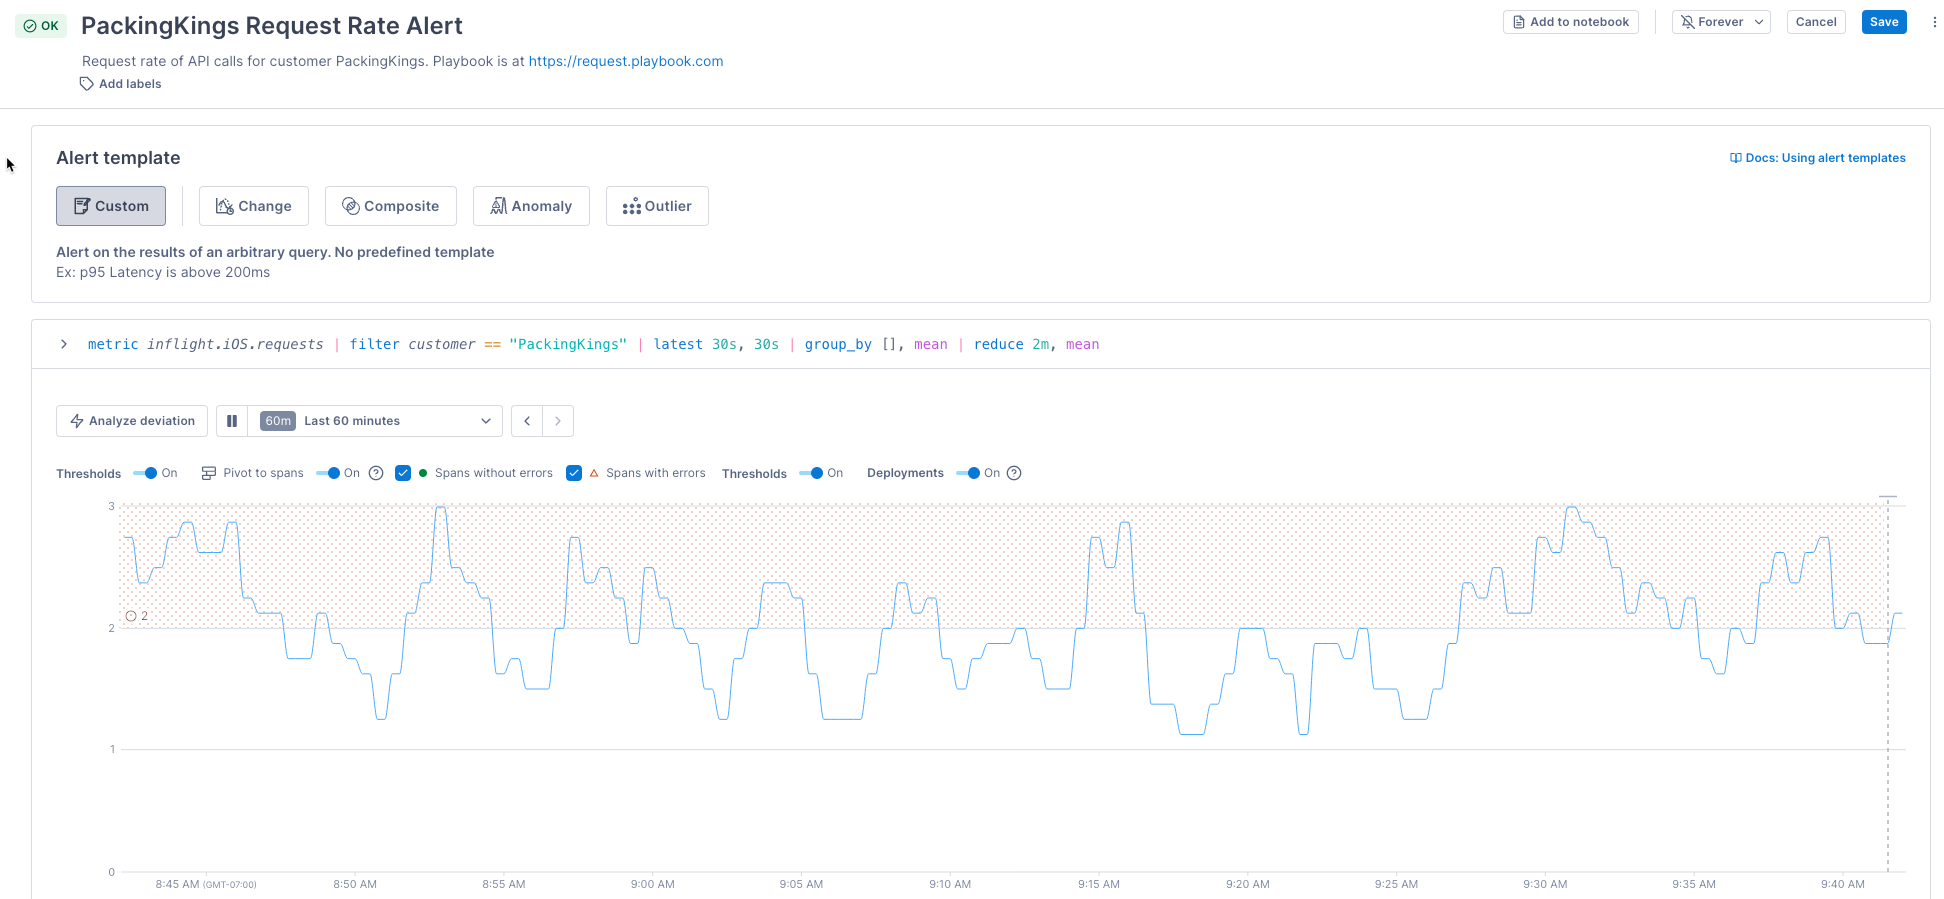
When you spot a deviation or other issue and want to start an investigation, you can use notebooks to run ad hoc queries and share findings with your team. 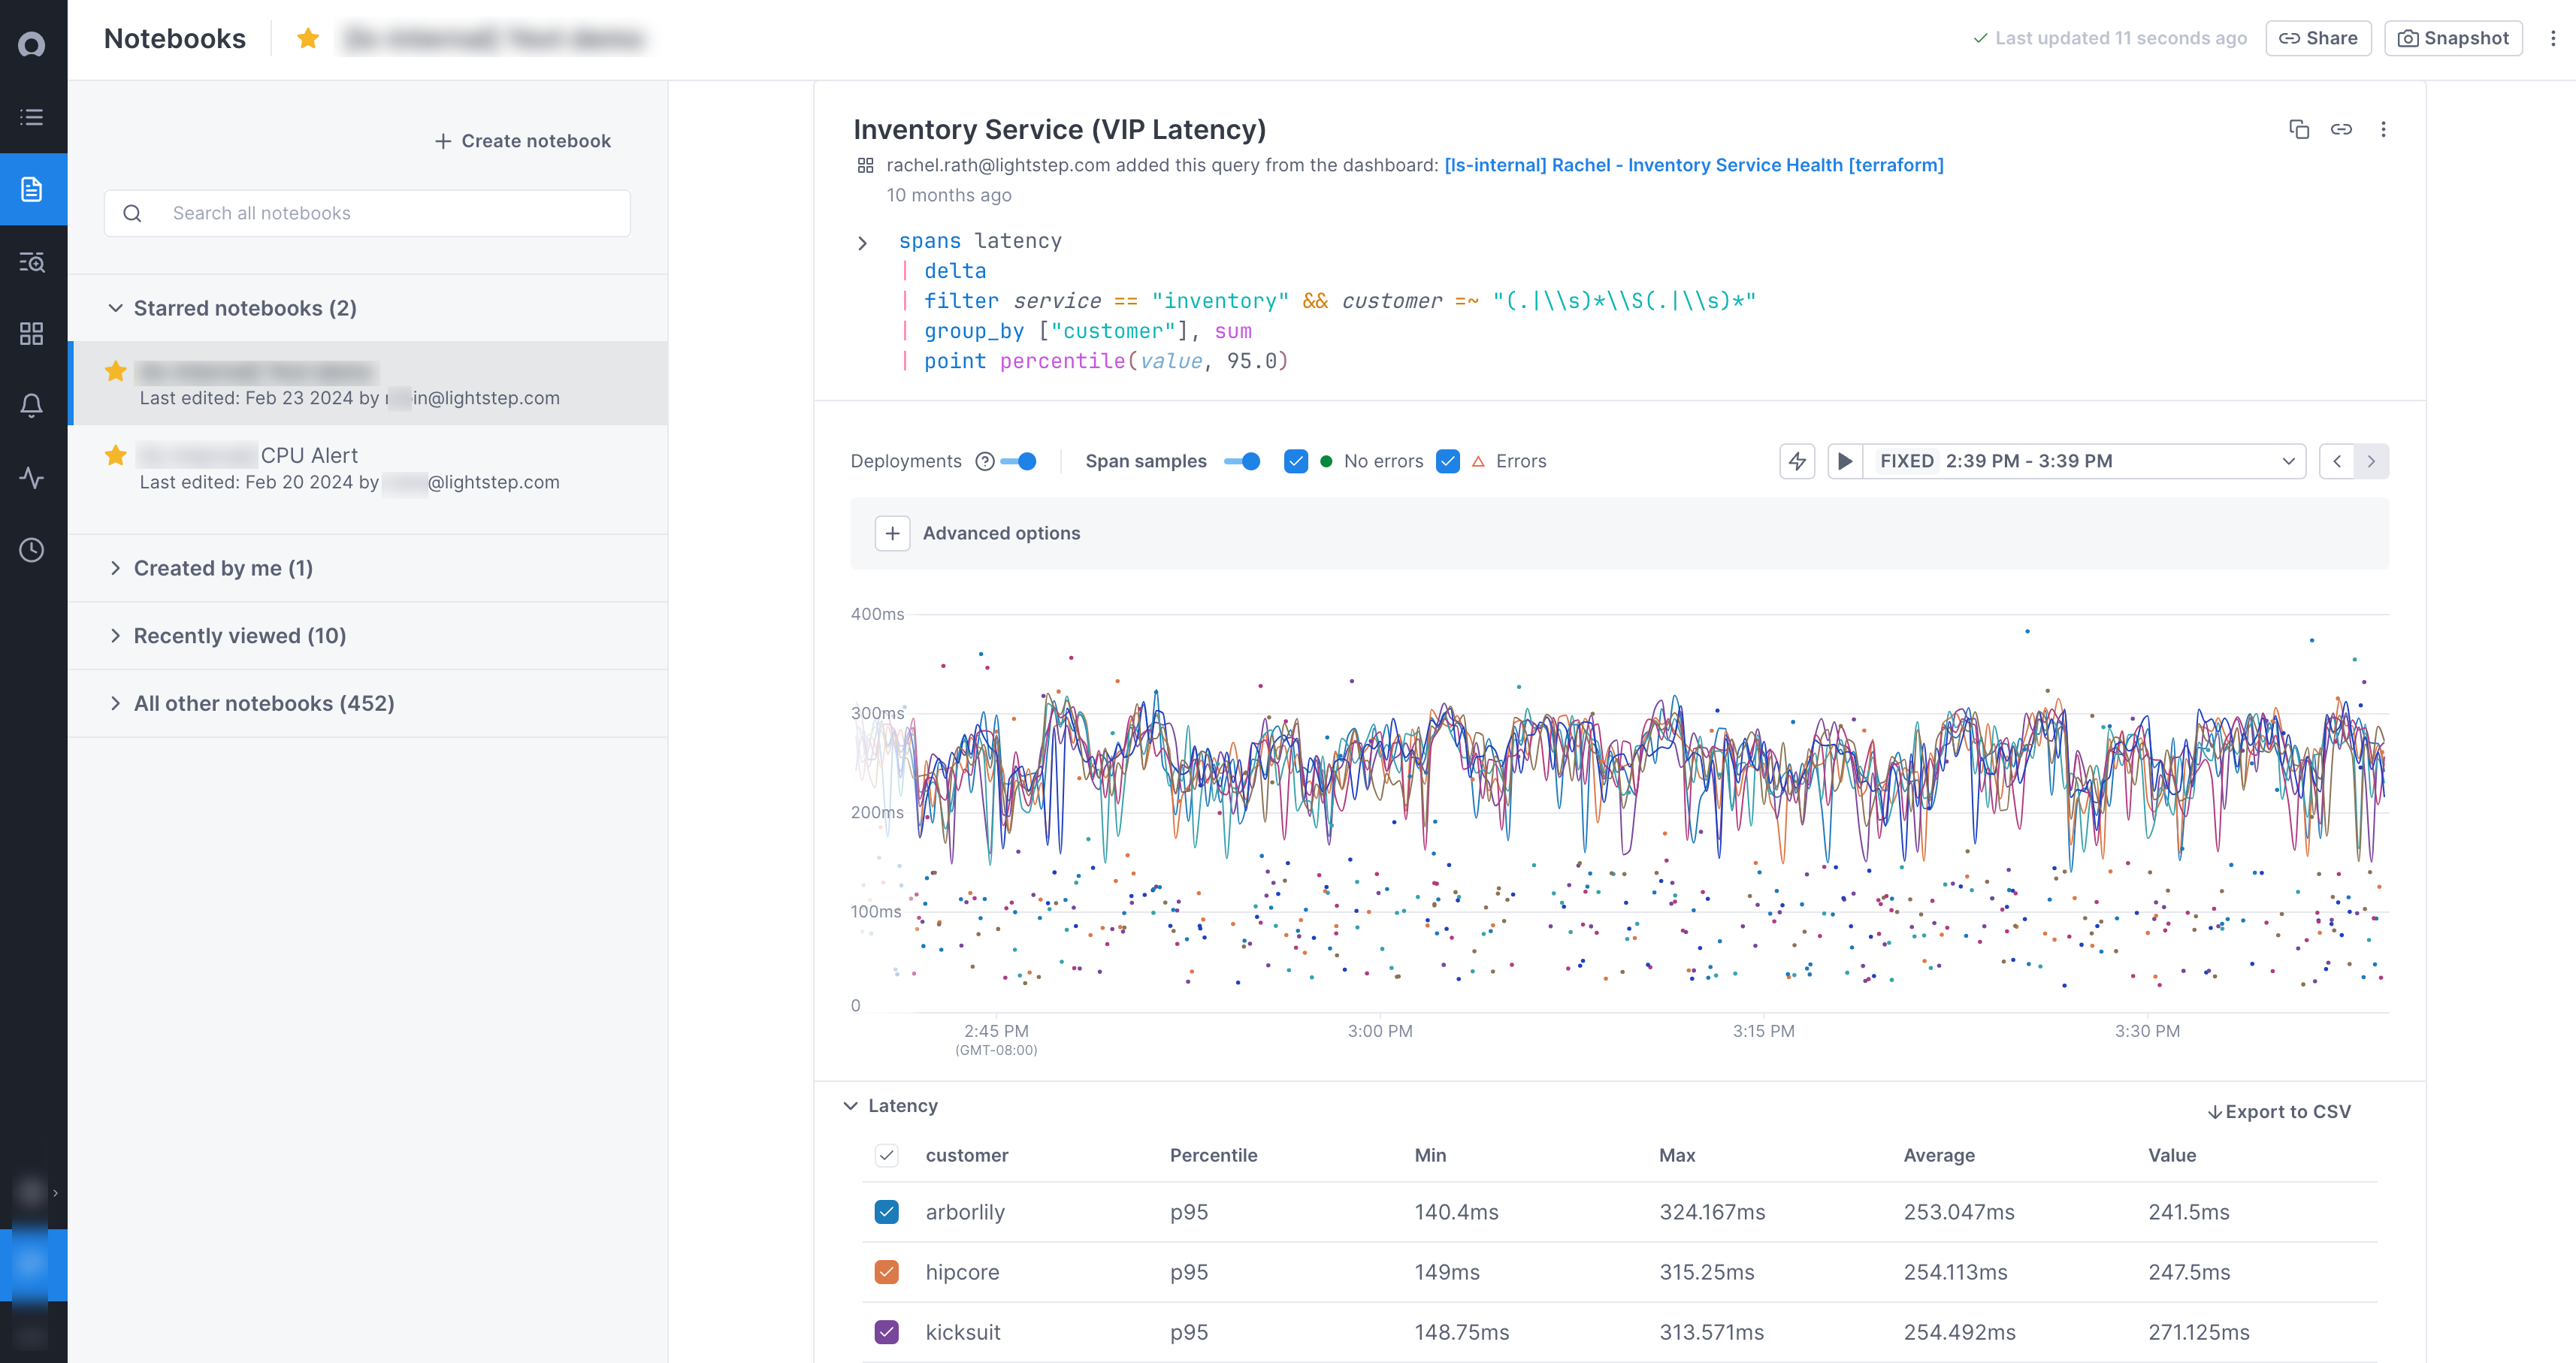
But more than telling you whether any given part of your system is unhealthy, you can use your metrics, traces, and Cloud Observability’s correlation feature to understand “what may have caused that change?” 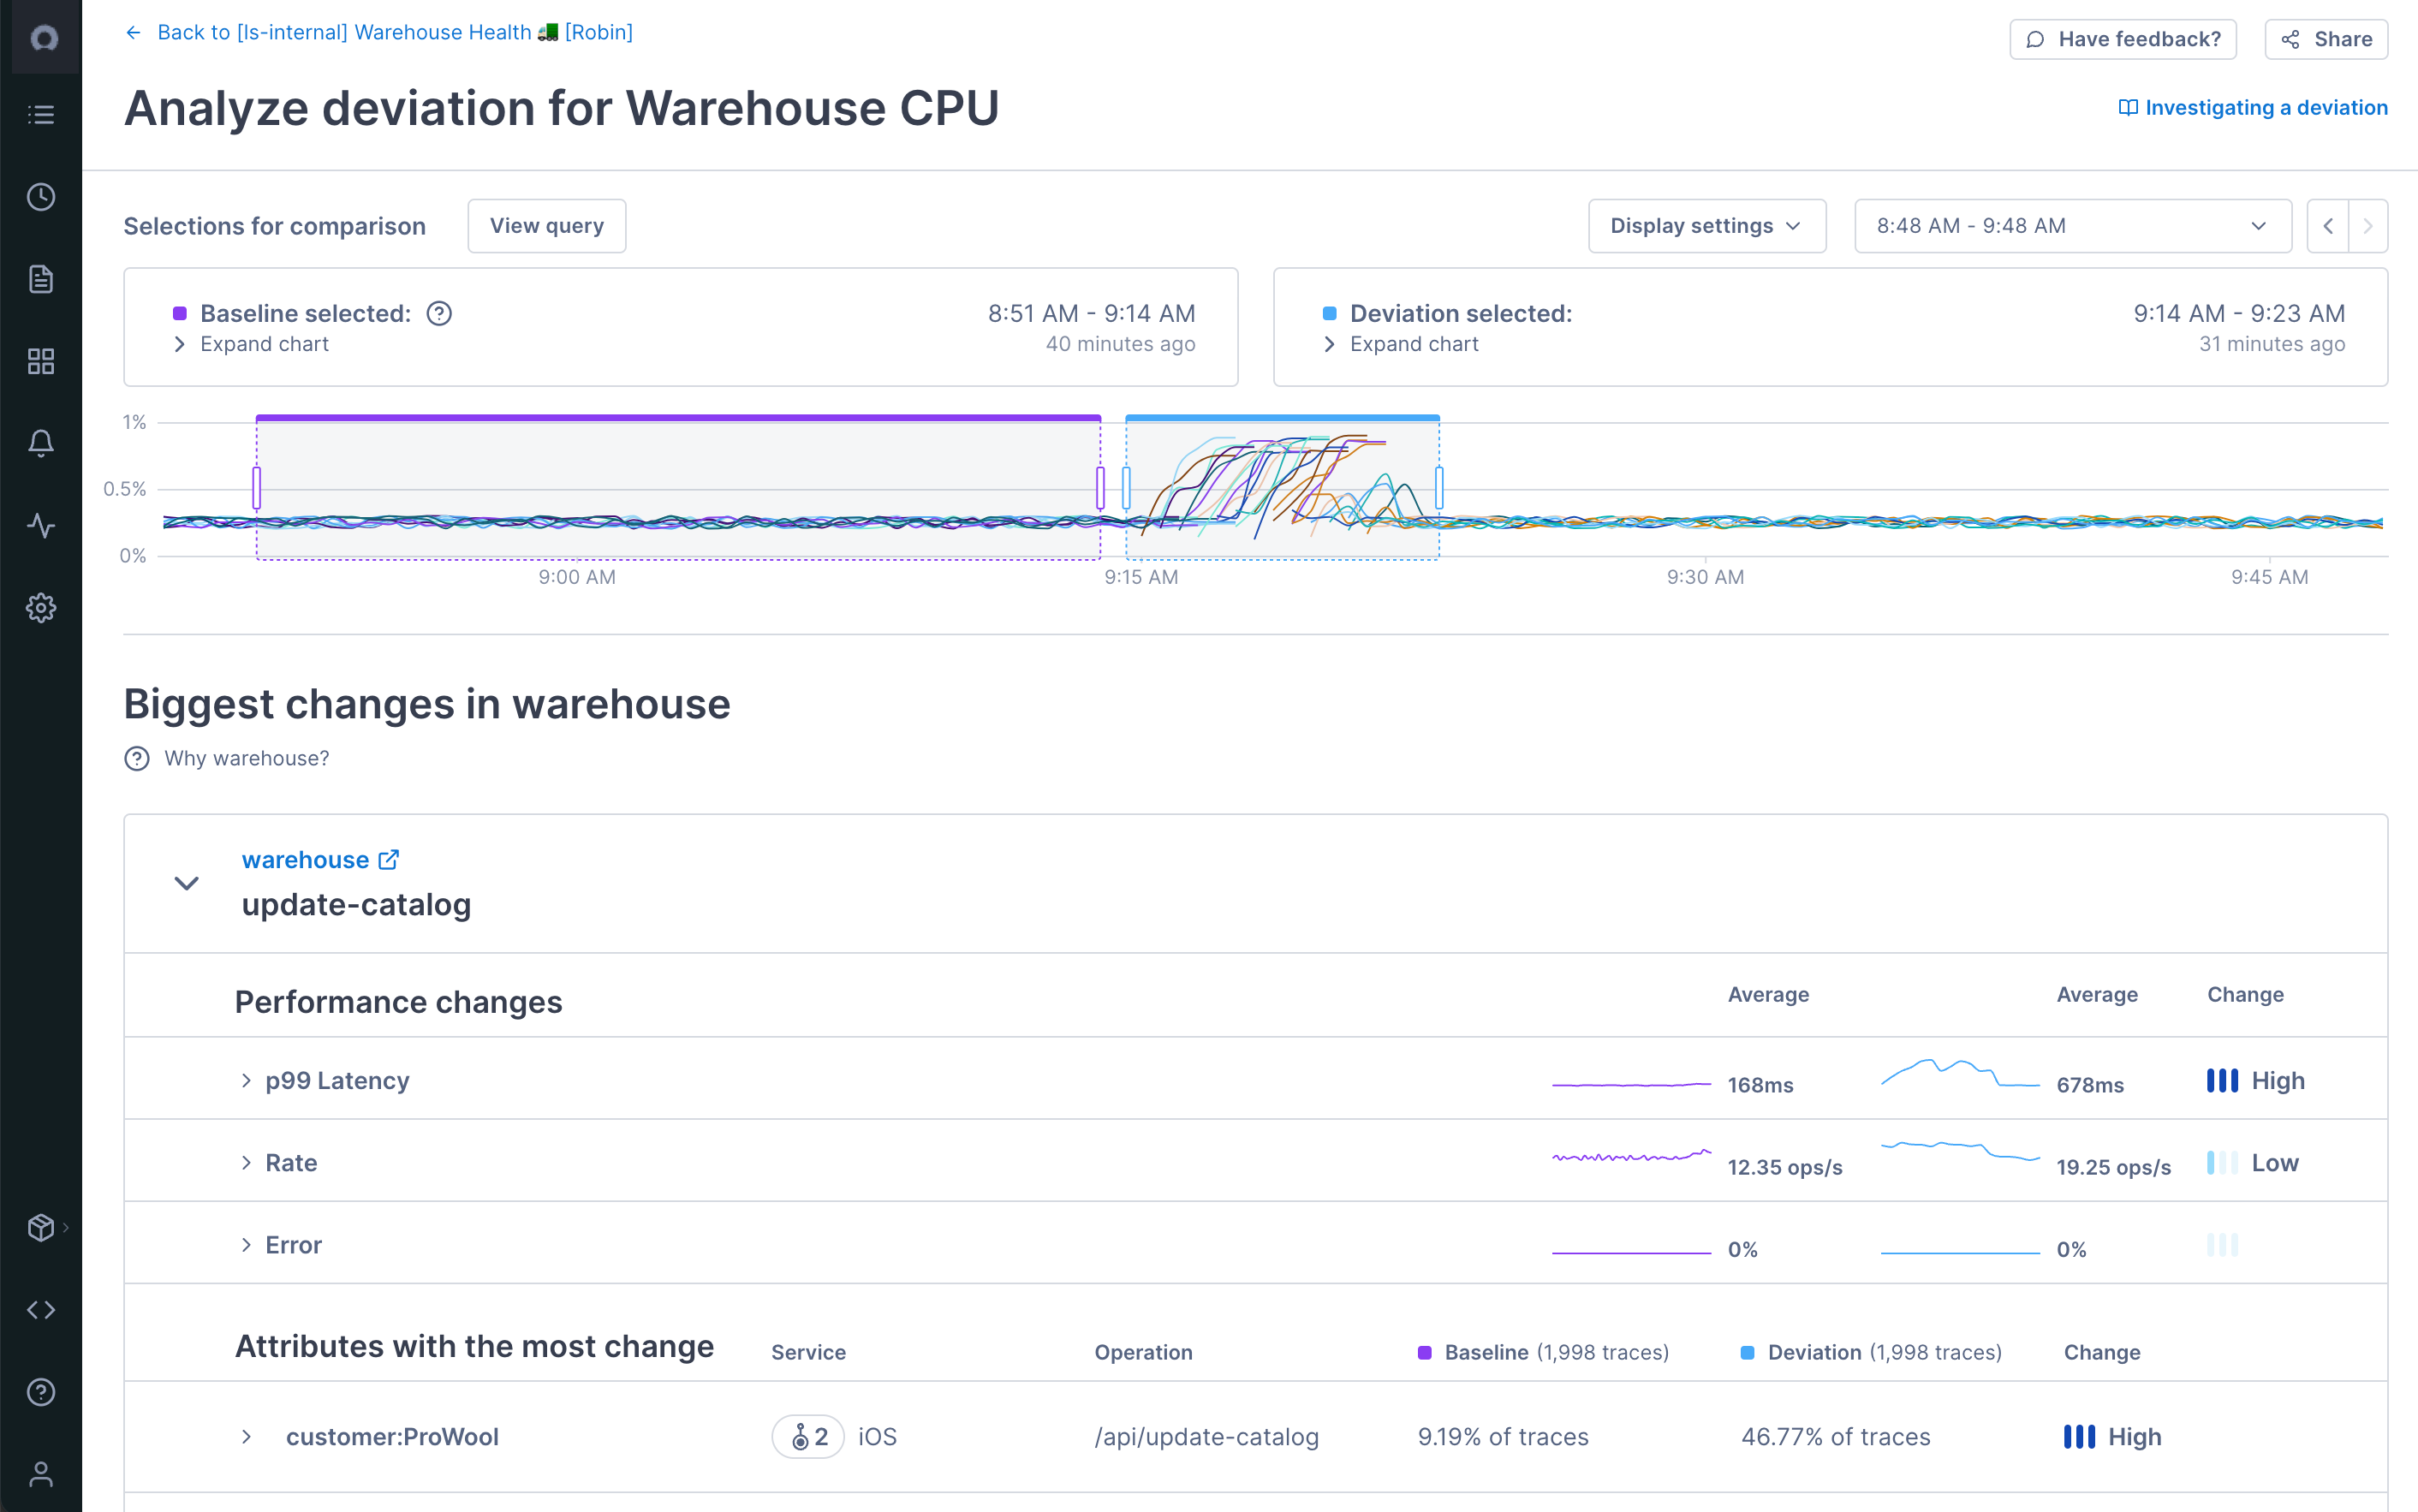
Learn about all of Cloud Observability’s monitoring and investigation tools.
See also
Updated Sep 11, 2023