The OpenTelemetry Collector, when configured with a Prometheus receiver, provides an integration with the NGINX Ingress Controller to scrape Prometheus metrics. The Collector uses the Prometheus Receiver to fetch metrics from the configured path in the NGINX Ingress Controller configuration file. From there, the metrics are processed and exported to Cloud Observability. This integration also includes using Kubernetes operators for both the Collector and the NGINX Ingress Controller.
To complete the integration, you will:
- Configure NGINX Ingress Controller to use the Prometheus exporter.
- Configure the Collector to use the NGINX Ingress Controller endpoint as a scrape target for the Prometheus receiver.
- Enable the integration by adding it to a pipeline.
Prerequisites
-
A deployed Kubernetes operator for both the Collector and the NGINX Ingress Controller.
See also Use Prometheus with an OpenTelemetry Collector on Kubernetes.
(Cloud Observability documentation) -
You’ve configured the Collector to export metric data to Cloud Observability.
Configure NGINX Ingress Controller reporting
You need to configure NGINX Ingress Controller to use the Prometheus exporter.
- In the NginxIngressController manifest (
nginx-ingress-controller.yaml), add the following to thespecobject:1 2 3 4
prometheus: create: true port: 9113 scheme: http
- Expose this port in the service to be sure that the Collector can scrape it. To do that, add a map for
customPortsatspec.controller.service.customPorts:
1
2
3
4
  service:
    create: true
    port: 9113
    scheme: http
For more details about using NGINX Ingress Controller with the Prometheus exporter, see the official NGINX Ingress Controller documentation.
Configure the Collector receiver
In the Collector configuration file, configure the Prometheus receiver to use the NGINX Ingress Controller config key in the Controller’s spec as a scrape target.
1
2
3
4
5
6
7
receivers:
  prometheus:
      config:
        scrape_configs:
          - job_name: otel-nginx-eg
            static_configs:
              - targets: ["my-nginx-nginx-ingress:9113"]
The OpenTelemetry repo’s README provides additional details about Prometheus receiver configuration.
More details about the Prometheus scrape configuration can be found here.
Enable the Collector receiver
Once the NGINX Ingress Controller receiver is configured, enable it by adding it to one or more pipelines as described in the Collector configuration documentation.
Validate metrics are reporting to Cloud Observability
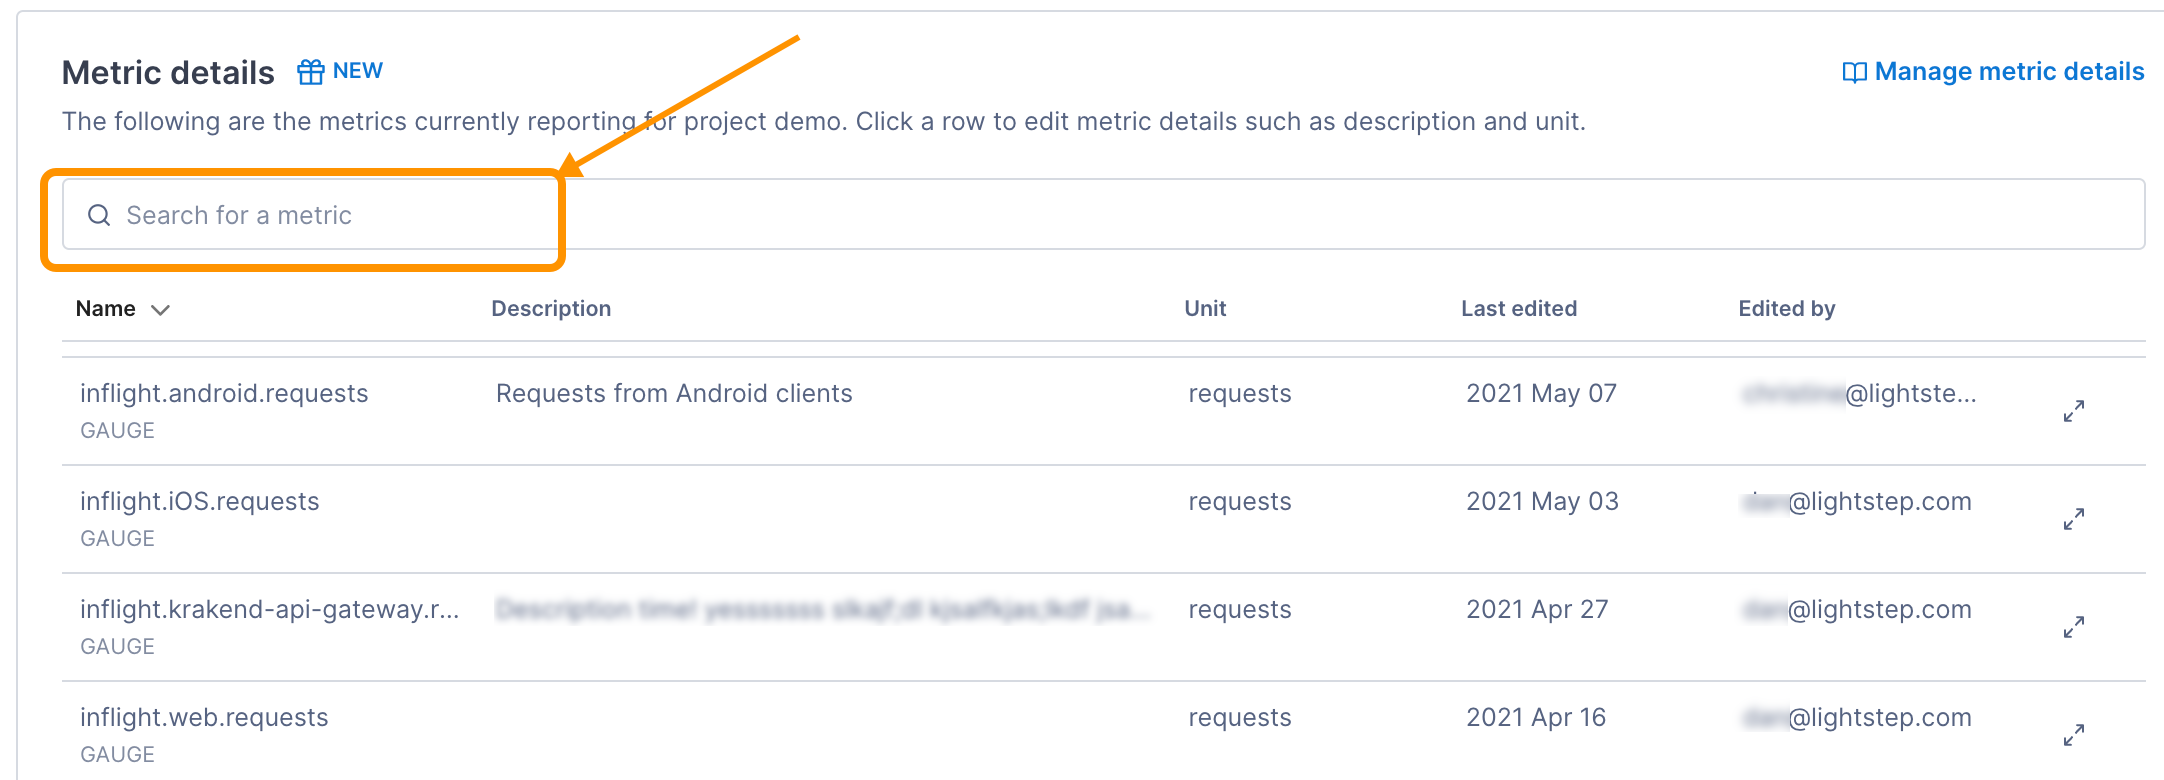
You can validate that metrics are reporting to Cloud Observability on the Metrics details page in Settings.
-
In Cloud Observability, click Settings > Metric details.
-
Search for NGINX Ingress Controller metric names.

See the NGINX docs for a complete list of emitted metrics.
-
If needed, click on the metric to edit the description and how the units are displayed in Cloud Observability.
Create a dashboard for the metrics
Use the Cloud Observability Terraform Provider to create a dashboard for the metrics.
Additional resources
-
For a more complete example that’s ready to run, see the NGINX Ingress Controller integration in Cloud Observability OpenTelemetry Examples
-
Replace Prometheus with an OpenTelemetry Collector on Kubernetes
(Cloud Observability documentation) -
Integrating OpenTelemetry into the Modern Apps Reference Architecture – A Progress Report
(NGINX blog post)
See also
Updated Dec 1, 2022
