
Once you’ve installed and configured your OpenTelemetry Collectors, you can monitor them to ensure they are sending data and are correctly configured. The Collector health page allows you to view each Collector sending data to Cloud Observability as well as their configuration.
This page displays pods only if you are running your Collectors in a Kubernetes environment.
When you see an issue, you can view the metrics from the Collectors in the pre-built Collector dashboard.
This dashboard works best if you’ve followed our Quickstart to install and run Collectors in Kubernetes.
How Collectors report health
The OpenTelemetry Open Agent Management Protocol (OpAMP) defines how to manage a fleet of telemetry agents. OpAMP agents that manage collectors can send and receive collector configurations along with status reports about collector health. Cloud Observability uses this protocol to ingest signals from Collectors so that the health of your fleet can be observed on the Collector Health page.
Collectors running in a Kubernetes environment use the OpAMP bridge as the agent. If you use one of the Kubernetes Quickstarts to install the Collector, the bridge is automatically enabled to send health metrics.
If you installed the Collectors using the quickstarts previous to April 3, 2024, follow the instructions below to update your Helm install.
If you didn’t use a Quickstart, follow the procedures to manually configure the bridge.
For non-Kubernetes environments, you need to use the opampextension as the agent and configure your Collectors manually.
The opampextension is in alpha as of open-telemetry-collector-contrib release v0.97.0, and it is also available for anyone using the OpenTelemetry Collector Builder.
Kubernetes: Update a Helm install
If you’ve previously used a quickstart to install Collectors, you may need to update your Helm install to enable the bridge. You also need to create an API key specifically for the bridge.
-
Create an API key specifically for the bridge, scoped to the project where the collectors are sending data and assigned the
OpAMP Agentrole. -
Set your API key as a Kubernetes secret named
otel-opamp-bridge-secretwith the keyLS_OPAMP_API_KEY.This key is automatically set as an environment variable in the OpAMP bridge for authentication into Cloud Observability.
-
Update your Helm repo to the latest release.
1
2
 helm repo add lightstep https://lightstep.github.io/otel-collector-charts
 helm repo update
-
Reinstall all the Collectors so that they report through the bridge.
1
2
3
4
5
6
7
 helm update otel-cloud-stack lightstep/otel-cloud-stack \
  -n default \
  --set logsCollector.enabled=true \
  --set tracesCollector.enabled=true \
  --set clusterName=your-cluster-name
  # --set otlpDestinationOverride="ingest.eu.lightstep.com:443" \ # EU data center
  # --set opAMPBridge.endpoint=wss://opamp.eu.lightstep.com/v1/opamp # EU data center
Kubernetes: Manually enable the OpAMP bridge
To allow this page to monitor your Collectors, you need to create an API key for the OpAMP bridge to communicate with Cloud Observability and then save it as a Kubernetes secret. You then need to configure your Collector to use the bridge.
- Create an API key specifically for the agent, scoped to the project where the collectors are sending data and assigned the
OpAMP Agentrole. -
Set your API key as a Kubernetes secret named
otel-opamp-bridge-secretwith the keyLS_OPAMP_API_KEY.This key is automatically set as an environment variable in the OpAMP bridge for authentication into Cloud Observability.
- Edit your Collector configuration file to use the OpAMP bridge.
- If you’re using Helm to manage Kubernetes, refer to this template for the bridge configuration.
- If you want to configure the Collector manually, refer to the
opAMPBridgeconfiguration in thisvalues.yamlfile as an example.
If you’re using the EU data center, set the
otlp endpointtoingest.eu.lightstep.comfor each Collector and set theopAMPBridge endpointto"wss://opamp.eu.lightstep.com".
Non-Kubernetes: Enable the opampextension
- Create an API key specifically for the agent, scoped to a project and assigned the
OpAMP Agentrole. - Set your API key as an environment variable named
LS_OPAMP_API_KEY. -
Edit the Collector config file to enable the OpAMP extension. Refer to the example below.
Under
extensions, add theopampserver endpoint and API key.We recommend using the WebSocket (ws) protocol for better realtime communication, but you can use
HTTPinstead. The endpoint values are the same.1 2 3 4 5 6 7 8
extensions: opamp: server: ws: endpoint: "wss://opamp.lightstep.com/v1/opamp" # endpoint: "wss://opamp.eu.lightstep.com/v1/opamp" # EU data center headers: Authorization: "bearer ${LS_OPAMP_API_KEY}"
See Troubleshoot the Collector page if functionality is missing after your install or update.
Monitor Collectors
You access the Collector health page from Settings.
-
In the navigation bar, click Settings and then Collectors.
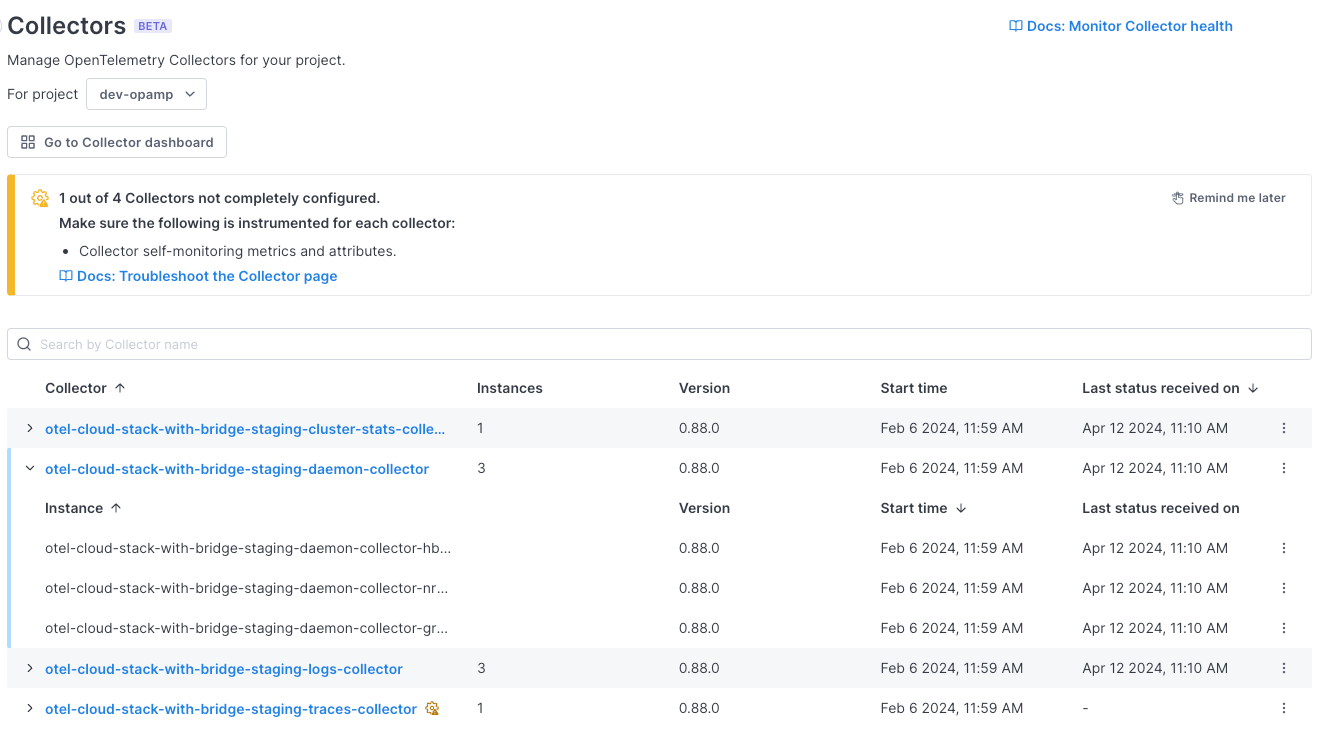
The page shows each Collector (the number in parenthesis is the number of pods running the Collector), its version, the time it was last started, and the time Cloud Observability last received telemetry data from the Collector.
Because this page’s functionality depends on the data being sent from the Collectors, a banner at the top of your page warns you if any Collectors are missing data or configuration (in the table, those collectors display a gear icon with an exclamation point). Following are descriptions of those warnings. For detailed steps on fixing any issues, see Troubleshoot the Collector page.
- Collector is missing self-monitoring metrics and attributes: We rely on specific metrics and attributes to display data in the table. See Troubleshoot the Collector page for more information.
- Add/update the OpAMP agent (bridge or extension) for configuration: You need to be using an OpAMP agent to view configurations. See How Collectors report health for instructions.
-
Expand the Collector’s row to view the individual pods running that Collector.
The pod view is only available if you are running your Collectors in a Kubernetes environment.
-
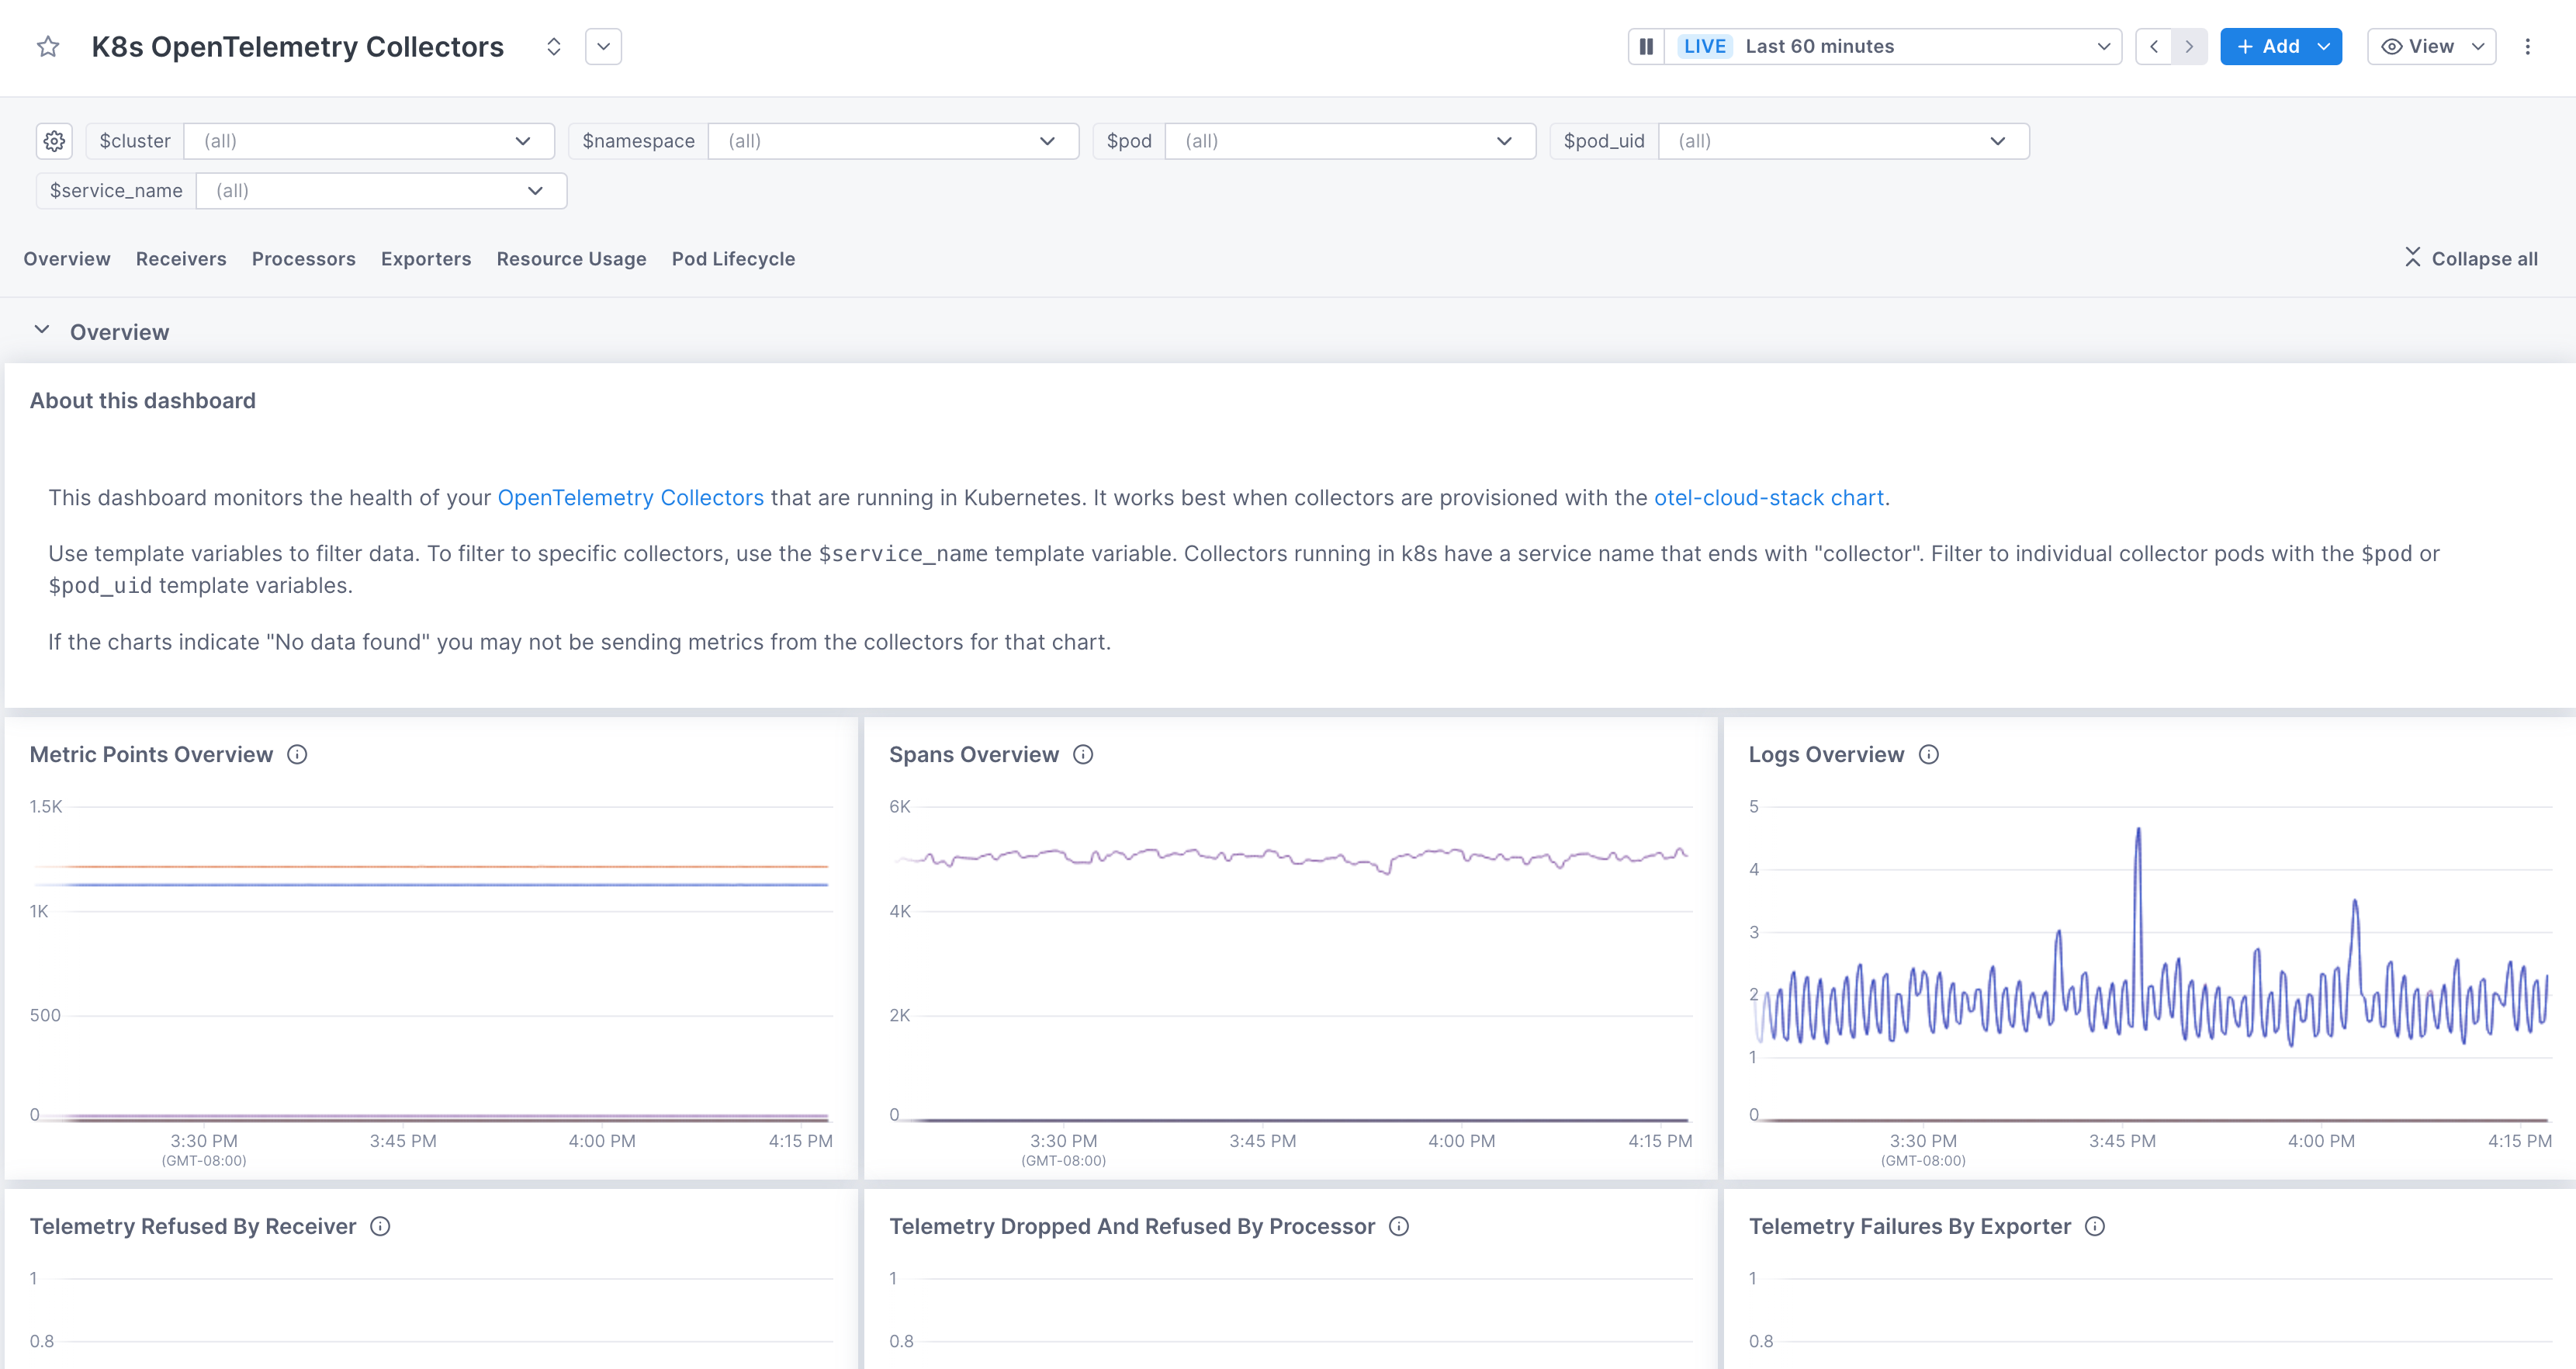
Click the More ( ⋮ ) icon to view the Collector in the pre-built K8s OpenTelemetry Collectors dashboard, filtered to the service and pod (if you navigate to the dashboard from a pod row).
If you haven’t already created this dashboard, it’s created for you. If you have more than one of these dashboards, you’re taken to the Dashboard list view, where you can choose one to open.
View Collector configuration
You can view and download the configuration of your Collectors. Hover over any Collector name and click View configuration. A visual representation of the Collector’s pipleline displays and below that is the YAML configuration file.
Click on a node in the pipeline to view the corresponding section in the configuration file.
You can also copy or download the YAML file for further troubleshooting.

Troubleshoot the Collector page
Because this page’s functionality depends on the data being sent from the Collectors, a banner at the top of your page warns you if any Collectors are missing data (in the table, those collectors display a gear icon with an exclamation point). Missing data may cause columns in the table to be empty.
Non-K8s environments are not able to populate the Start time column.
Follow these steps to help remediate issues.
General
-
Use the Collector dashboard to ensure logs, metrics, and/or traces are being sent to Cloud Observability. The Metric Points, Spans, and Logs Overview charts should show data.
-
The best way to ensure this page is fully functional is to use an OpAMP agent with your Collector. Follow the steps in How Collectors report health for your environment.
Missing data in the table
Message: Collector is missing self-monitoring metrics and attributes
Refer to the following table for the expected attributes:
| Column name | K8s attribute | Non-K8s attribute |
|---|---|---|
| Version | service.version |
service.version set to version number of the Agent build. |
| Start time | k8s.pod.start_time |
Not available |
| Last status received time | Based on: otelcol_exporter_sent_metric_points, otelcol_exporter_sent_spans, and otelcol_exporter_sent_log_records |
|
Missing Collector configuration
Message: Add the OpAMP agent (bridge or extension) for configuration
-
Kubernetes: Helm charts need to enable scraping of the Collector metrics. The easiest way to get this configuration is to use our Helm charts for installation (update your charts and reinstall if you’ve installed prior to 4/03/24.)
If you can’t use the Helm charts, see lines 1-47 of our Helm chart for an example of the configuration.
-
Non-Kubernetes: Refer to our recommended Collector configuration example.
Message: Update to the latest charts to access the configuration
Reinstall the Collectors to enable the OpAMP bridge. See Kubernetes: Update a Helm install
Troubleshoot Collectors
If your Collectors are not sending data, or seem to be sending incorrect data, read the following topics:
- Recommended Collector configuration to ensure you’ve configured Collectors properly for Cloud Observability.
- Technology recommendations to ensure your environment is using supported technologies.
- Troubleshooting missing data in Cloud Observability for general data issues.
- OpenTelemetry Collector Troubleshooting Guide on GitHub.
See also
General guidelines for configuring Collectors
Use the OpenTelemetry Collector
Updated Jul 1, 2024