
Running the OpenTelemetry Collector as a DaemonSet
This topic covers instructions to deploy the OpenTelemetry Collector using Kubernetes DaemonSet to ingest Prometheus metrics. A DaemonSet is a type of workload that ensures that every Kubernetes Node has a running instance.
You can also deploy the Collector using a Kubernetes Deployment or a StatefulSet.
Read Plan an OpentTelemetry Collector deployment to determine which method to use.
To scale the Collector with a Daemonset, you configure the Collector to only scrape application metrics from its nodes. Optionally, you can run another single Collector in Deployment mode to scrape static targets and infrastructure metrics if needed.
Prerequisites
- Local install of Helm.
- A Cloud Observability access token.
- Have the OpenTelemetry Operator and Cert Manager running in your cluster.
This topic covers the steps to deploy two OpenTelemetry Collectors, one in DaemonSet mode and optionally, a second one in Deployment mode, in a Kubernetes Cluster. You will need to (in this order):
- Install the OpenTelemetry Collector DaemonSet
- Configure the OpenTelemetry Collector deployment to scrape infrastructure metrics and static targets, if needed
Install the OpenTelemetry Collector DaemonSet
-
From the Cloud Observability otel-collector-charts repository, copy the
charts/collector_k8sfolder to your existing directory. - Set the shell variable
LS_TOKENto your Cloud Observability access token.1
export LS_TOKEN=”<ACCESS_TOKEN>”
- Install the OpenTelemetry Collector using the
collector_k8s/values-daemonset.yamlvalues.1 2 3
kubectl create namespace opentelemetry kubectl create secret generic otel-collector-secret -n opentelemetry --from-literal=LS_TOKEN=$LS_TOKEN helm upgrade lightstep ./charts/collector-k8s -f ./charts/collector-k8s/values-daemonset.yaml -n opentelemetry --install
- Verify that the daemonset Collector is up and running, You should see one pod in “ready” state for each node on your cluster.
1
kubectl get daemonset -n opentelemetry
This Collector will scrape all pods that are annotated with the
prometheus.io/scrape: trueannotation, which is per pod. You can adjust theprometheus.io/portannotation to scrape a port of your choice instead of the default. - In Cloud Observability, use a Notebook to verify that the metric
otelcol_process_uptimeis reporting to your Cloud Observability project. You can group this metric byk8s.pod.nameto see all pods that were created. You should expect one pod for each node on your Kubernetes Cluster.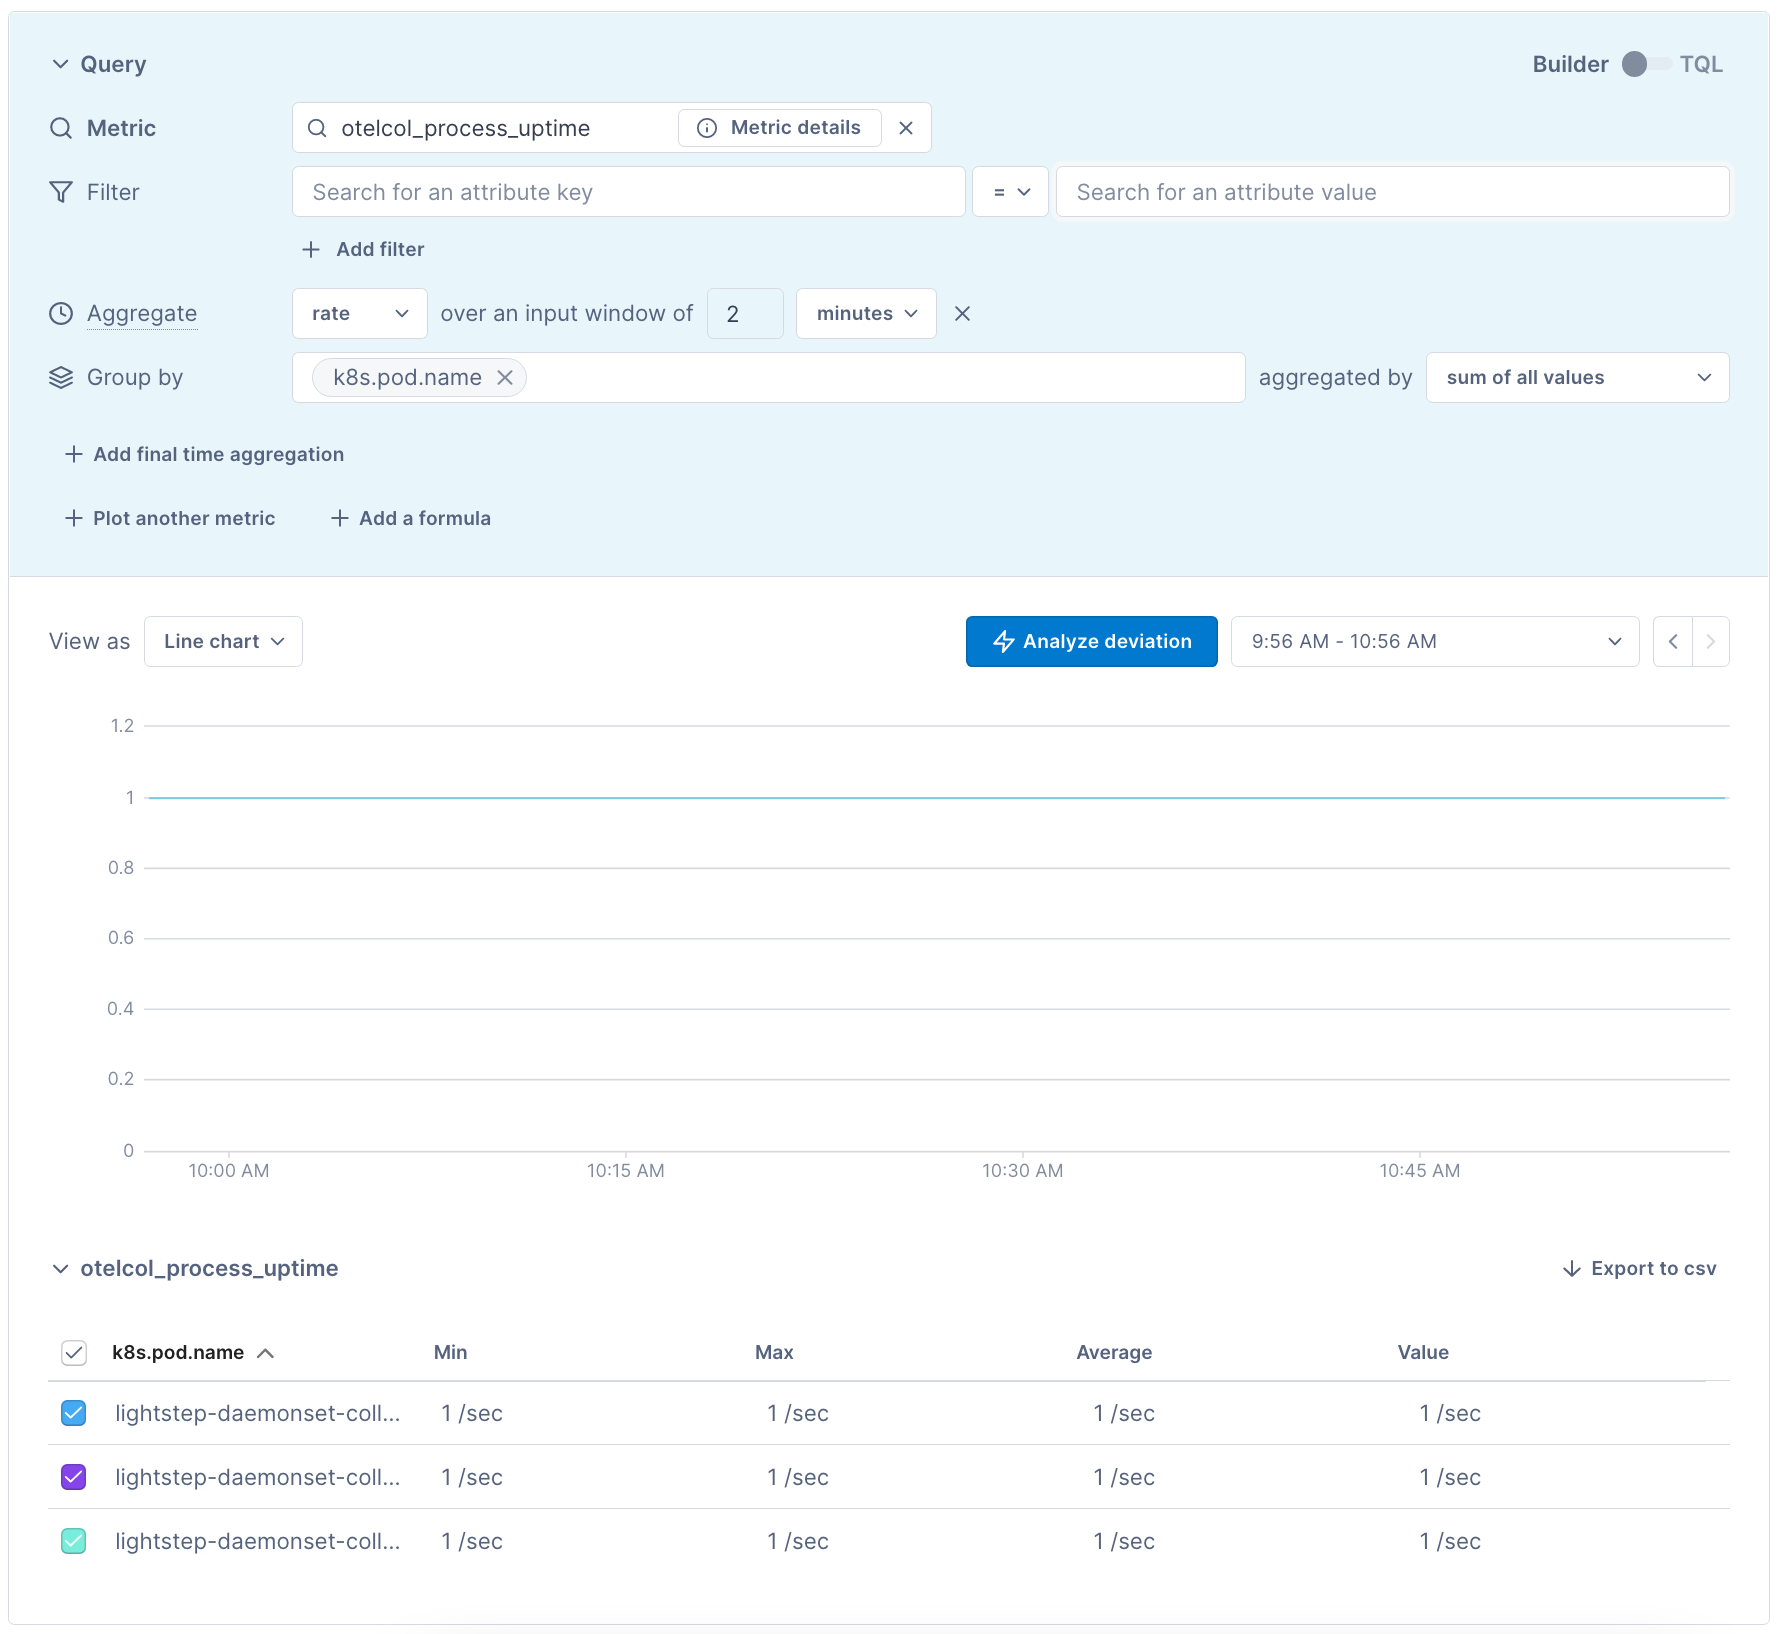
Additionally, verify that your applications are being scraped by the Collector with the metric scrape_samples_scraped grouped by service.name. You should see the amount of samples scraped from each application. At this point, you can start querying your app metrics.

If you don’t see this metric, you might not have set your token correctly. Check the logs of your Collector pod for access token not found errors using: % kubectl logs -n opentelemetry <collector pod name>.
If you see these errors, make sure that the correct token is saved in your otel-collector-secret and has write metrics permissions.
Next, you can configure the deployment Collector to scrape your infrastructure metrics.
(Optional) Configure the Deployment Collector to scrape your infrastructure metrics
The DaemonSet Collector deployment has been configured to scrape application metrics from its nodes. In order to scrape static targets and infastructure metrics, run a second OpenTelemetry Collector as a single replica deployment.
-
Add your additional scrape targerts to the
scrape_configs.yaml. This should contain static targets that are not discovered by the Kubernetes service discovery in the DaemonSet Collector. - Enable the secondary Collector Deployment by setting
enabledtotruein thecollectorsarray element named asdeploymentin thevalues-daemonset.yamlfile.
Once complete, upgrade the Collector’s chart to incorporate the new changes.1
helm upgrade lightstep ./charts/collector-k8s -f ./charts/collector-k8s/values-daemonset.yaml -n opentelemetry --install
- Using Notebooks, verify that your applications are being scraped by the Collector with the metric
scrape_samples_scrapedgrouped byservice.name.
Collector Troubleshooting
The first thing you should do when troubleshooting collector issues is make sure data from your network can reach Cloud Observability. Your firewall or cloud configuration may be preventing a connection.
The default OTLP Exporter from a Collector enables gzip compression and TLS.
Depending on your network configuration, you may need to enable or disable
certain other gRPC features. This
page
contains a complete list of configuration parameters for the Collector gRPC
client.
In the event that you are unable to establish a gRPC connection to the Cloud Observability
Observability platform, you can use the
grpcurl tool to ensure connectivity
from your network to our public satellites. Run the following command, replacing
<YOUR_ACCESS_TOKEN> with your project’s access
token:
1
2
grpcurl -H 'lightstep-access-token:<YOUR_ACCESS_TOKEN>' ingest.lightstep.com:443 list #US data center
# grpcurl -H 'lightstep-access-token:<YOUR_ACCESS_TOKEN>' ingest.lightstep.eu.com:443 list #EU data center
You should see the following output, or something similar:
1
2
3
4
5
grpc.reflection.v1alpha.ServerReflection
jaeger.api_v2.CollectorService
lightstep.collector.CollectorService
lightstep.egress.CollectorService
opentelemetry.proto.collector.trace.v1.TraceService
If you do not see this output, or the request hangs, then something is blocking
gRPC traffic from transiting your network to ours. Please ensure that any
proxies are passing through the lightstep-access-token header.
Alternately, you can also try emitting a single span to your project using the otel-cli tool. We have an example image and commands for running the CLI tool in Kubernetes and Docker on GitHub. Only send test spans to a non-production project.
For additional troubleshooting recommendations, see Troubleshooting Missing Data in Cloud Observability.
See also
Ingest Prometheus metrics with an OpenTelemetry Collector on Kubernetes
Updated Jul 26, 2022