
Running the OpenTelemetry Collector as a StatefulSet
This topic covers instructions to deploy the OpenTelemetry Collector using a Kubernetes StatefulSet to replace an existing Prometheus setup. A StatefulSet is a type of workload like a Deployment, but assigns each pod a consistent id. This also enables collectors to be stateful.
To scale the Collector with a StatefulSet, an external application called the Target Allocator (TA) is required. The TA dynamically assigns Prometheus targets to each collector in the StatefulSet, ensuring that each target is scraped only once. This method allows you to scale the StatefulSet both horizontally and vertically to match your cluster topology.
Prerequisites
- Local install of Helm.
- A Cloud Observability access token.
- Have the OpenTelemetry Operator and Cert Manager running in your cluster.
Currently, we do not recommend the StatefulSet to all customers. Autoscaling is still in beta and high availability for the target allocator is a work in progress. The ability to dynamically discover new jobs through a ServiceMonitor or PodMonitor is also a work in progress.
Install the OpenTelemetry Collector StatefulSet
-
From the Cloud Observability otel-collector-charts repository, copy the
charts/collector_k8sfolder to your existing directory. - Set the shell variable
LS_TOKENto your Cloud Observability access token.1
export LS_TOKEN=”<ACCESS_TOKEN>”
- Add your existing scrape configuration
Edit the ./charts/collector-k8s/scrape_configs_statefulset.yaml file and append your existing scrape configuration to the bottom of the file. If you are unsure on how to find your existing scrape configuration, see the troubleshooting section.
- Install the OpenTelemetry Collector using the
collector_k8s/values-statefulset.yamlvalues.1 2 3
kubectl create namespace opentelemetry kubectl create secret generic otel-collector-secret -n opentelemetry --from-literal=LS_TOKEN=$LS_TOKEN helm upgrade lightstep ./charts/collector-k8s -f ./charts/collector-k8s/values-statefulset.yaml -n opentelemetry --install
- Verify that the StatefulSet Collector is up and running, You should see three pods in “ready” state in the namespace.
1
kubectl get statefulset -n opentelemetry - In Cloud Observability, use a Notebook to verify that the metric
otelcol_process_uptimeis reporting to your Cloud Observability project. You can group this metric byk8s.pod.nameto see all pods that were created. You should expect three pods to appear from the StatefulSet.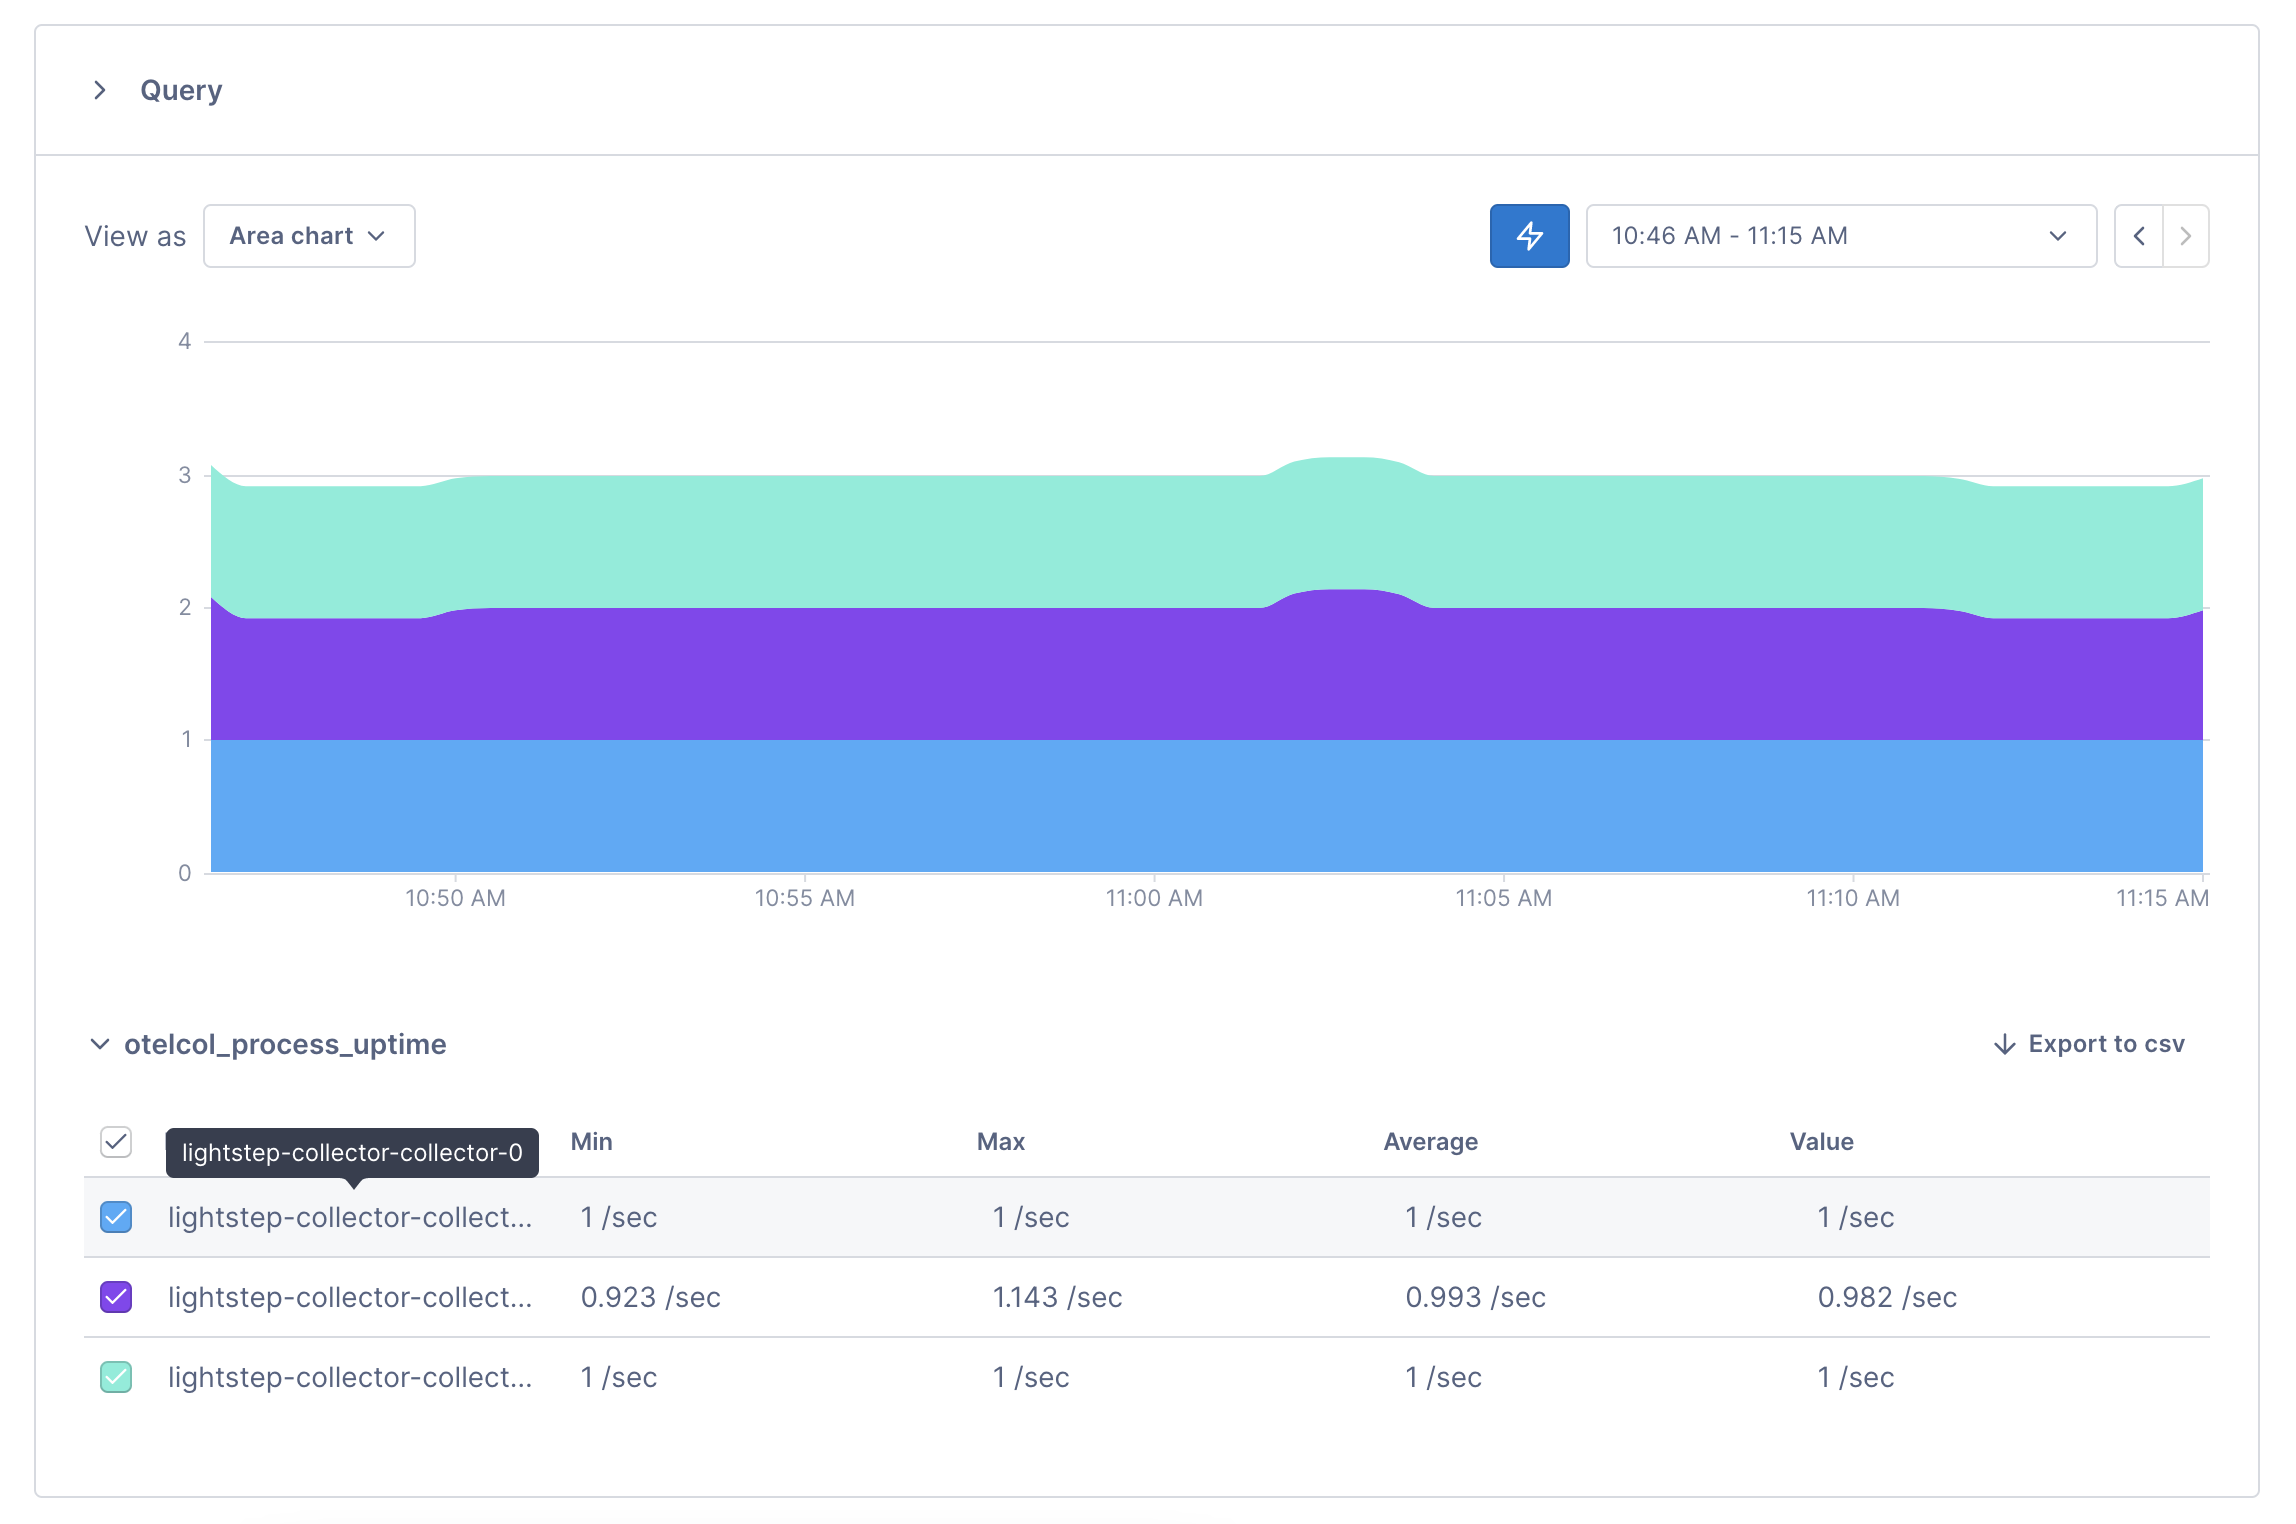
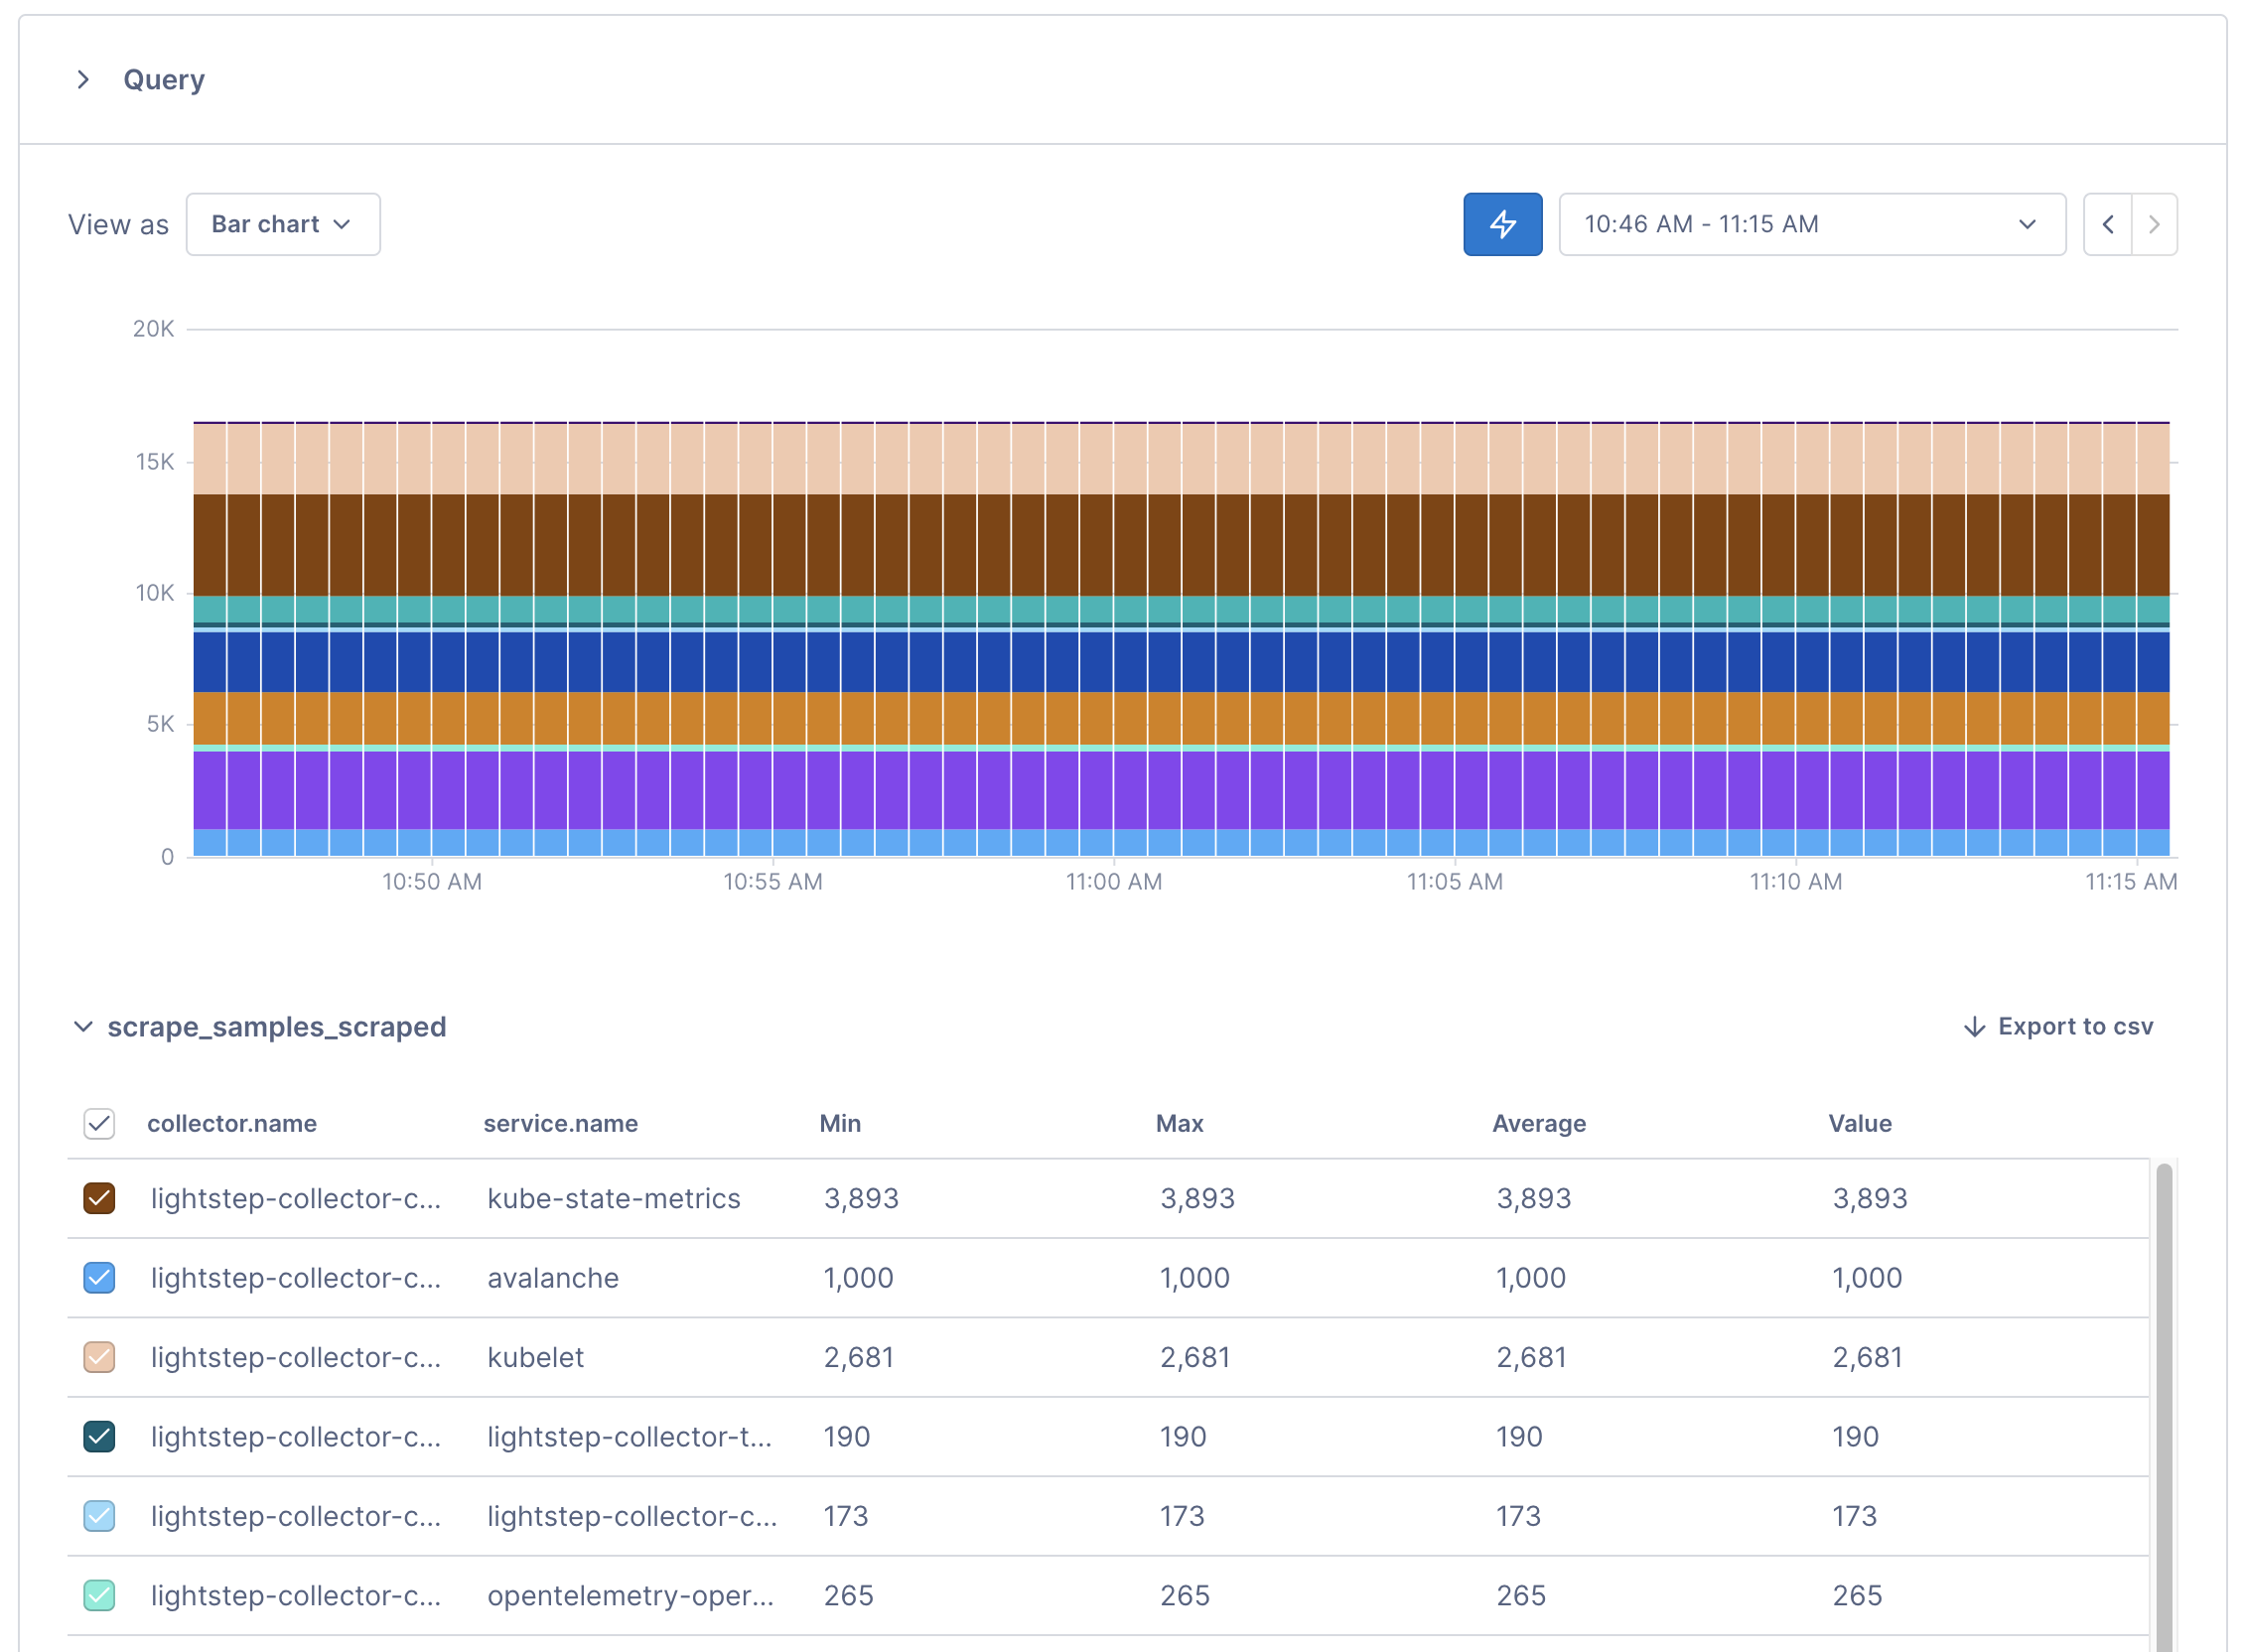
Additionally, verify that your applications are being scraped by the Collector with the metric scrape_samples_scraped grouped by service.name and collector.name. You should see the amount of samples scraped from each application by each collector in the StatefulSet. At this point, you can start querying your app metrics.
If you don’t see this metric, you might not have set your token correctly. Check the logs of your Collector pod for access token not found errors using: % kubectl logs -n opentelemetry <collector pod name>.
If you see these errors, make sure that the correct token is saved in your otel-collector-secret and has write metrics permissions.
Troubleshooting
If you don’t know how to find your scrape configuration in your existing Prometheus setup, follow the steps below:
Now that the Collector is available, you run a Cloud Observability Docker image in the namespace of your Prometheus server to extract and save the scrape_config file. An existing Prometheus server is required for this step.
- Check that your Prometheus pod is healthy and all containers are running.
Replace<namespace>and<prometheus pod name>with your Prometheus server’s namespace and pod name.1
% kubectl get pod -n <namespace> <prometheus pod name> - Run the following command to identify the pod ip address where your Prometheus server is running.
1
% kubectl get pods -n <namespace> <prometheus pod name> -o jsonpath='{.status.podIP}' - Extract and save your Prometheus configuration into
scrape_configs.yaml.
Replace<namespace>and<pod ip address>with your Prometheus server’s namespace and pod ip address.1
% kubectl run --rm --quiet -i -n <namespace> --image=lightstep/prometheus-config-helper:latest --env="PROMETHEUS_ADDR=<pod ip address>:9090" --restart=Never get-prometheus-scrape-configs > charts/collector_k8s/scrape_configs.yaml
Depending on the state of the Prometheus server, this may fail and leave the
scrape_configs.yamlfile empty. If it does, you may safely rerun the command. -
(Optional) Edit your
scrape_config.yamlto exclude any scrape targets you want to omit.
Use#to omit individual lines.
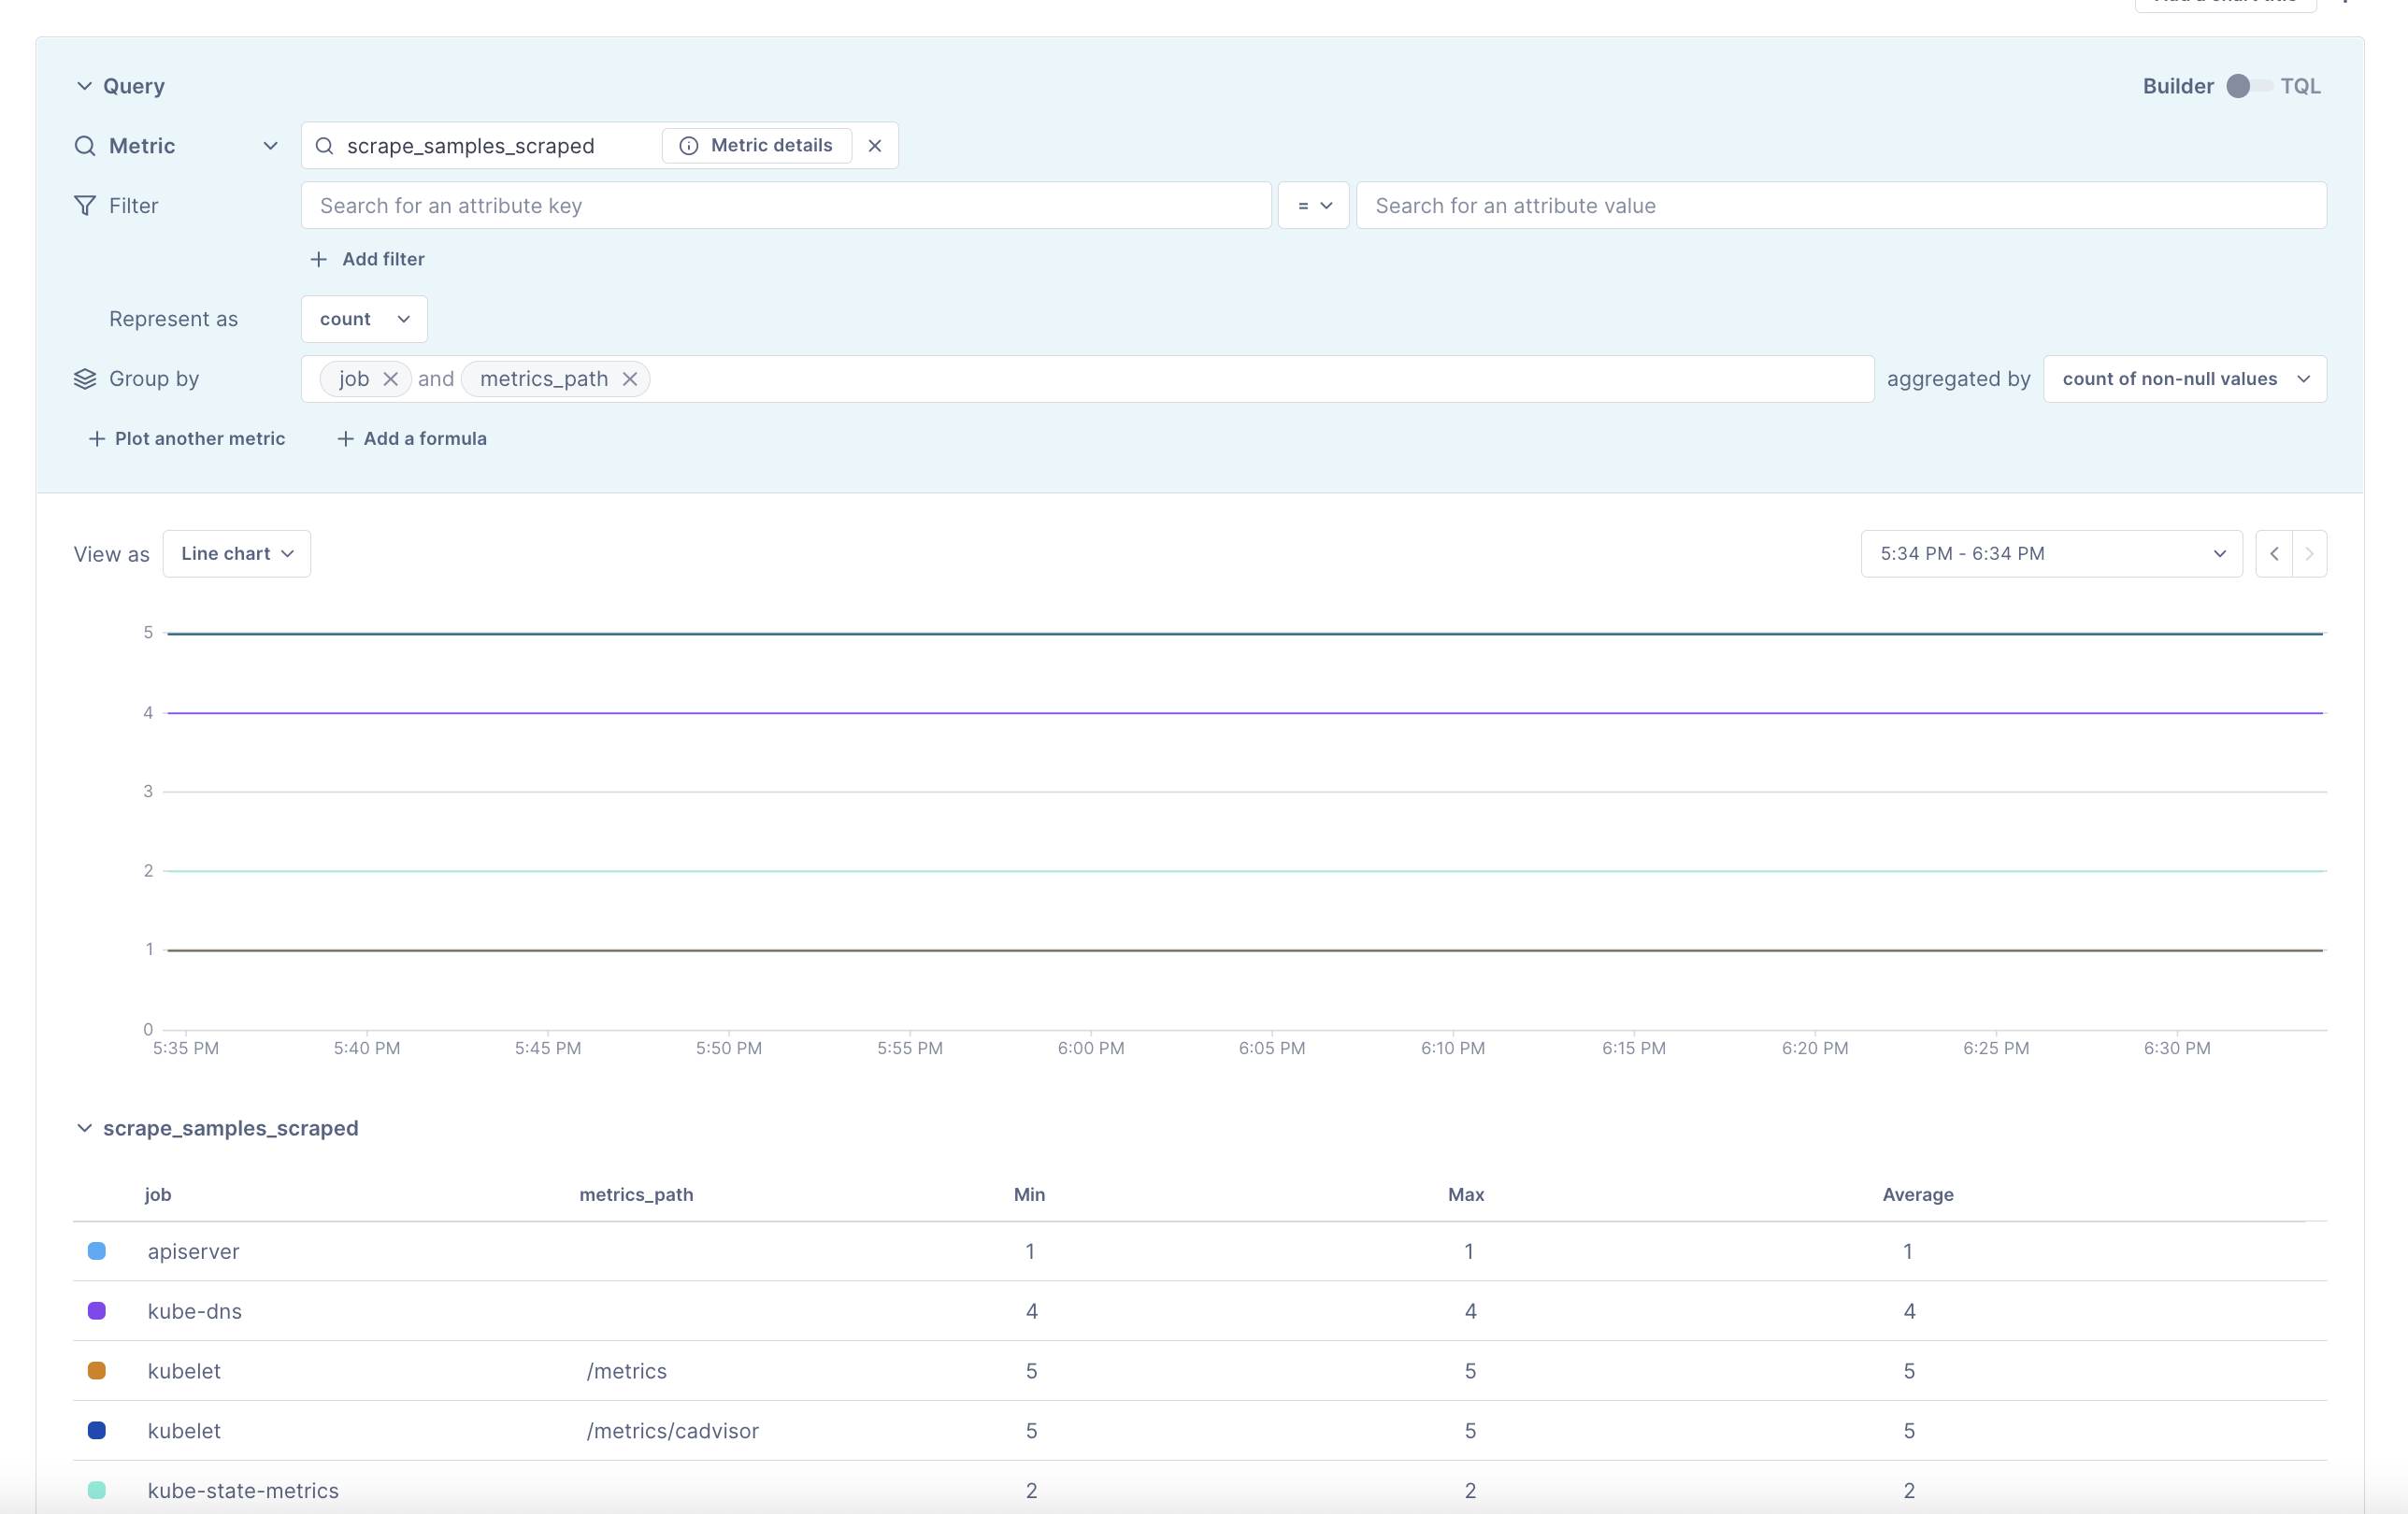
Once complete, upgrade the Collector’s chart provided by Cloud Observability’s example respository to incorporate the new changes. - Verify your scrape targets are appearing using Notebooks.
See also
Ingest Prometheus metrics with an OpenTelemetry Collector on Kubernetes
Run the Collector as a DaemonSet
Updated Aug 30, 2022