Want to use OpenTelemetry instead? Read these docs to get started!
Follow these steps to configure your tracer to communicate with the Cloud Observability Microsatellites and create a single span on your service. You install both the OpenTracing API and Lightstep tracer and then use the OpenTracing and Cloud Observability APIs to instrument your code.
To ensure you can access all Cloud Observability functionality, including infrastructure metrics reporting, update your tracer to the latest release. To update, simply follow the instructions for installing the tracer. No code changes are needed.
While Lightstep offers tracers and APIs specific to its tracing software, you will still use the OpenTracing API to fully instrument your code. Be sure you have read and are familiar with both Lightstep tracers and the OpenTracing specification in your application’s language.
Java Instrumentation for OpenTracing
- Find your access token in Lightstep. You’ll need this to configure your Lightstep tracer.
- Click the Project Settings button.
- In the Access Tokens table, click the Copy icon to copy your access token to the clipboard.
-
Install the Lightstep tracer by adding dependencies and modifying your build file as described here
Be sure to use correct version numbers! Replace the version numbers in the code example with the correct versions for your environment.
-
Import the Lightstep tracer and OpenTracing interfaces.
1
2
3
import com.lightstep.tracer.shared.Options;
import com.lightstep.tracer.jre.JRETracer;
import io.opentracing.Span;
-
Early in your application’s initialization, configure the Lightstep tracer. As part of the configuration, you need to add your access token and add your service’s name.
1
2
3
4
5
6
7
8
public class App {
  public static void main(String[] args) throws Exception {
    Options opts = new Options.OptionsBuilder()
      .withAccessToken("YOUR_ACCESS_TOKEN")
      .withComponentName("YOUR_SERVICE_NAME")
      .build();

JRETracer tracer = new JRETracer(opts);
-
Test that everything is connected by sending a test span. Annotate the span by adding a tag (key/value pair) and logs, then flush the tracer.
1
2
3
4
5
6
Span span = tracer.buildSpan("handler").startActive();
span.setTag("Lorem", "Ipsum");
span.log("Lorem Ipsum Dolor");
span.finish();

tracer.flush(500);
Full code sample:
1
2
3
4
5
6
7
8
9
10
11
12
13
14
15
16
17
18
19
20
21
import com.lightstep.tracer.shared.Options;
import com.lightstep.tracer.jre.JRETracer;
import io.opentracing.Span;

public class App {
    public static void main(String[] args) throws Exception {
        Options opts = new Options.OptionsBuilder()
                .withAccessToken("YOUR_ACCESS_TOKEN")
                .withComponentName("YOUR_SERVICE_NAME")
                .build();

        JRETracer tracer = new JRETracer(opts);

        Span span = tracer.buildSpan("handler").start();
        span.setTag("KEY", "VALUE");
        span.log("Lorem Ipsum Dolor");
        span.finish();

        tracer.flush(500);
    }
}
-
Run your app.
- Open Lightstep. You should see your service in the Service directory list.
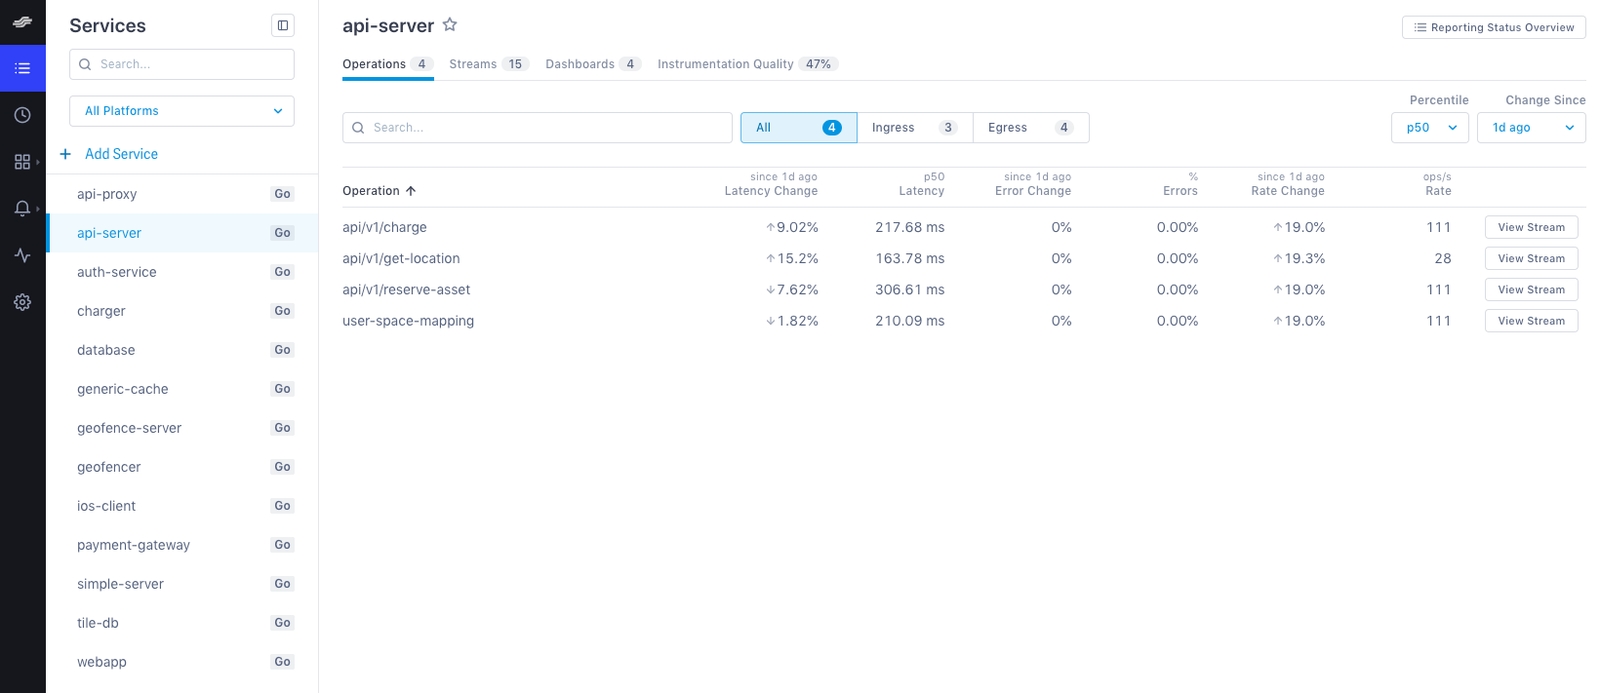
It may take a few moments for your service to display in the Service Directory. To see data immediately, click the Explorer tab to view data in the histogram.
Read the OpenTracing Java README on GitHub to learn more.
See also
Understand distributed tracing
Updated Nov 23, 2019